Impact Analysis


Preface
Conducting traffic analysis for years, we observed how traffic patterns can change under external conditions not depending on the behavior of drivers. Road construction projects, special events, fairs, festivals, and even COVID have the greatest impact on traffic patterns leading to fluctuations in traffic volumes, increased travel delays, and congestion. Some of these impacts are temporary, while others have a lasting effect, shaping new trends in traffic behavior.
Ignoring external factors in traffic analysis can lead to incorrect estimations and missed opportunities in decision-making. Our case study examines the impacts of road construction projects, sporting events, and the COVID-19 pandemic on traffic demand to prove the importance of modern methods of traffic data analysis. By utilizing these techniques, one can accurately detect and account for external factors to guarantee accurate traffic volume estimations for site selection and planning purposes.
Part I. Road closures
According to the data provided by FHWA, during summer months about 20% of the National Highway System is under construction, impacting traffic in over 6,400 work zones. Moreover, some road reconstruction projects may last much longer than just a couple of months in summer. For example, the well-known Boston Big Dig project involving a replacement of the multi-mile steel roadway, a.k.a. Green Monster, with a tunnel, took 25 years. This is, of course, an extreme case, but a great number of construction projects take from several months to a couple of years.
Business communities adjacent to road closures may experience negative impacts from road construction projects. In fact, companies largely dependent on vehicle traffic may face disruption in customer flow due to road closures or detours. These, along with loss of access, poor signing, and project length, have the greatest impact on business. With the loss of customer flow, the company could obviously experience a considerable reduction in revenue.
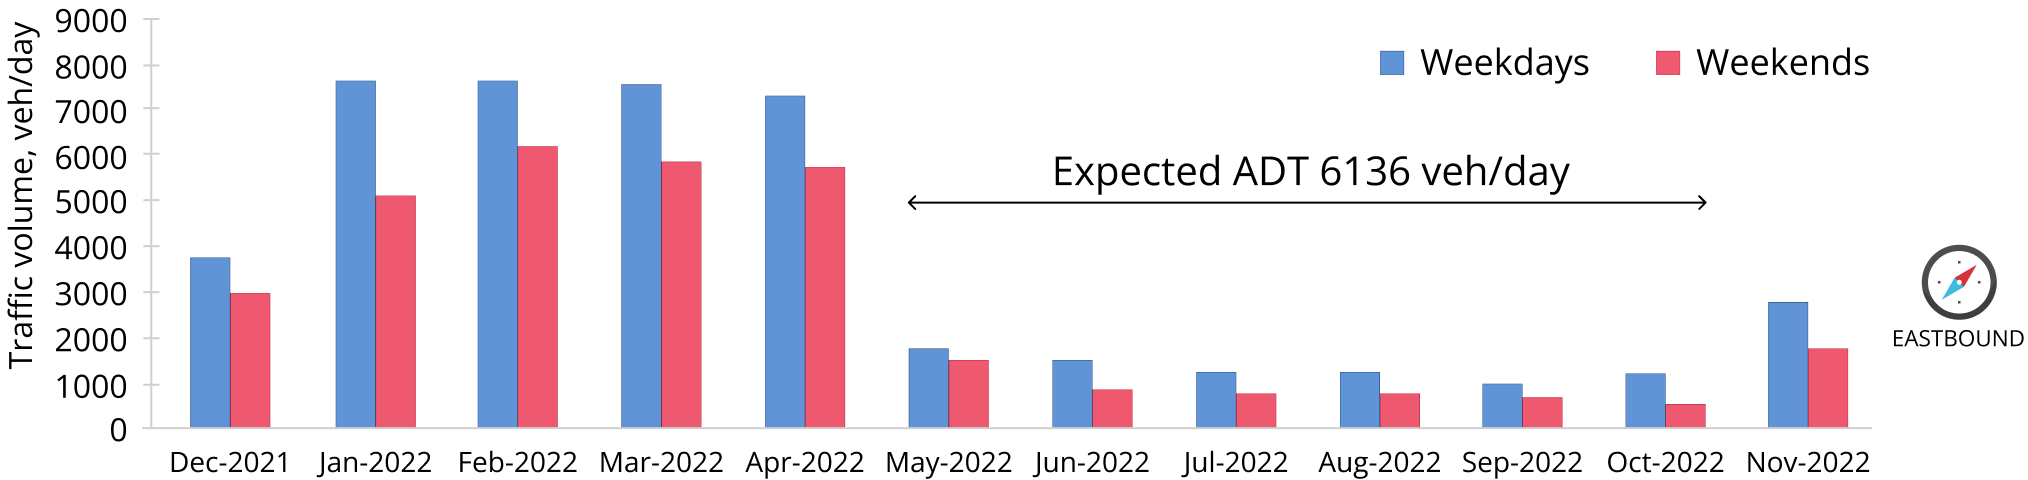
Conducting the analysis of minor arterial West View Road, we noticed an untypical reduction of traffic volumes started in May 2022, which was caused by a new road construction project in the area.
Ticon decided to analyze the effect of West View Road closure on traffic demand. Overall, the road can be described as a typical residential artery (FRC 4), with 2 lines in each direction, a speed limit of 55 mph/h, and a moderate volume of traffic between neighborhoods.
Figures 1 show that for the Eastbound direction of West View Road, from March 2022 to August 2022 the traffic volumes decreased approximately by 70% for both weekdays and weekends. The westbound direction of this road suffered a similar impact leading to traffic volume reduction.
As West View Road has been closed since May 2022, drivers had to adjust their day-to-day road routines and select other route options. However, this does not mean an equal increase of traffic flow on other roads that drivers choose as detours (Figure 2), although we observed the ADT increase.
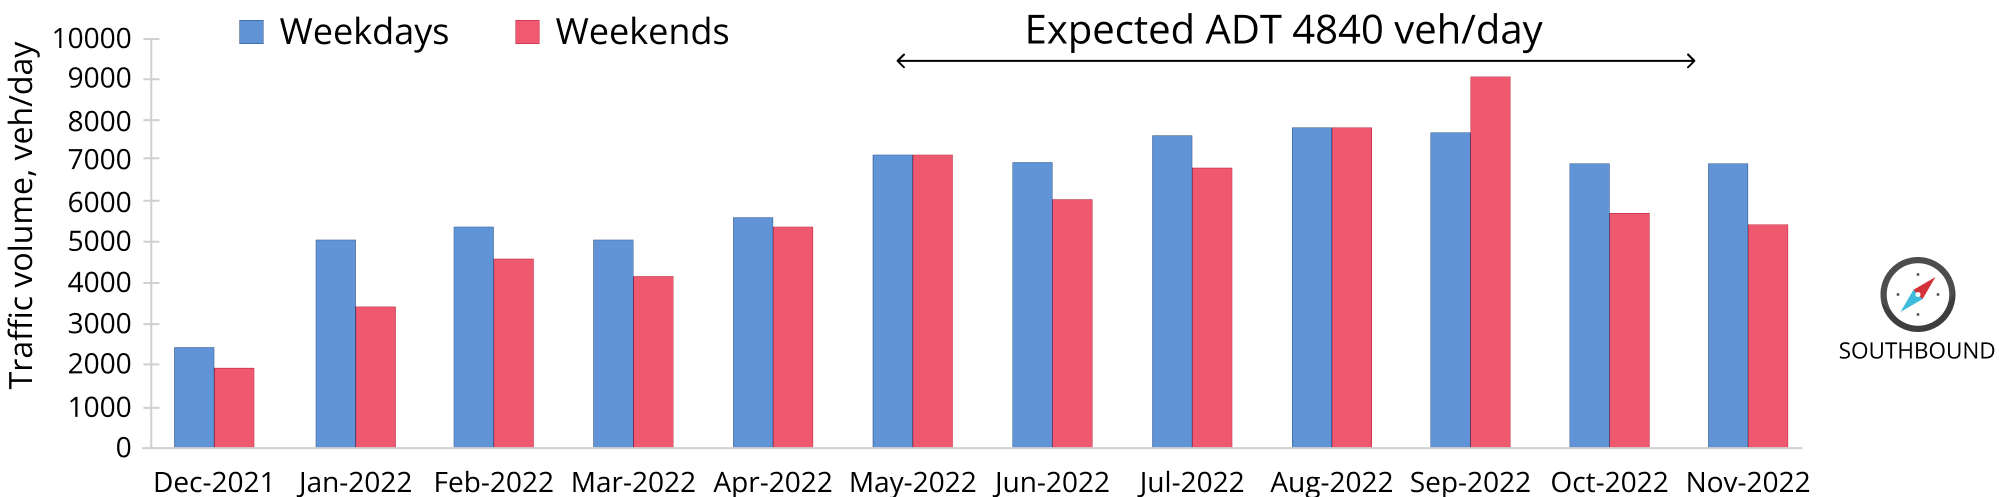
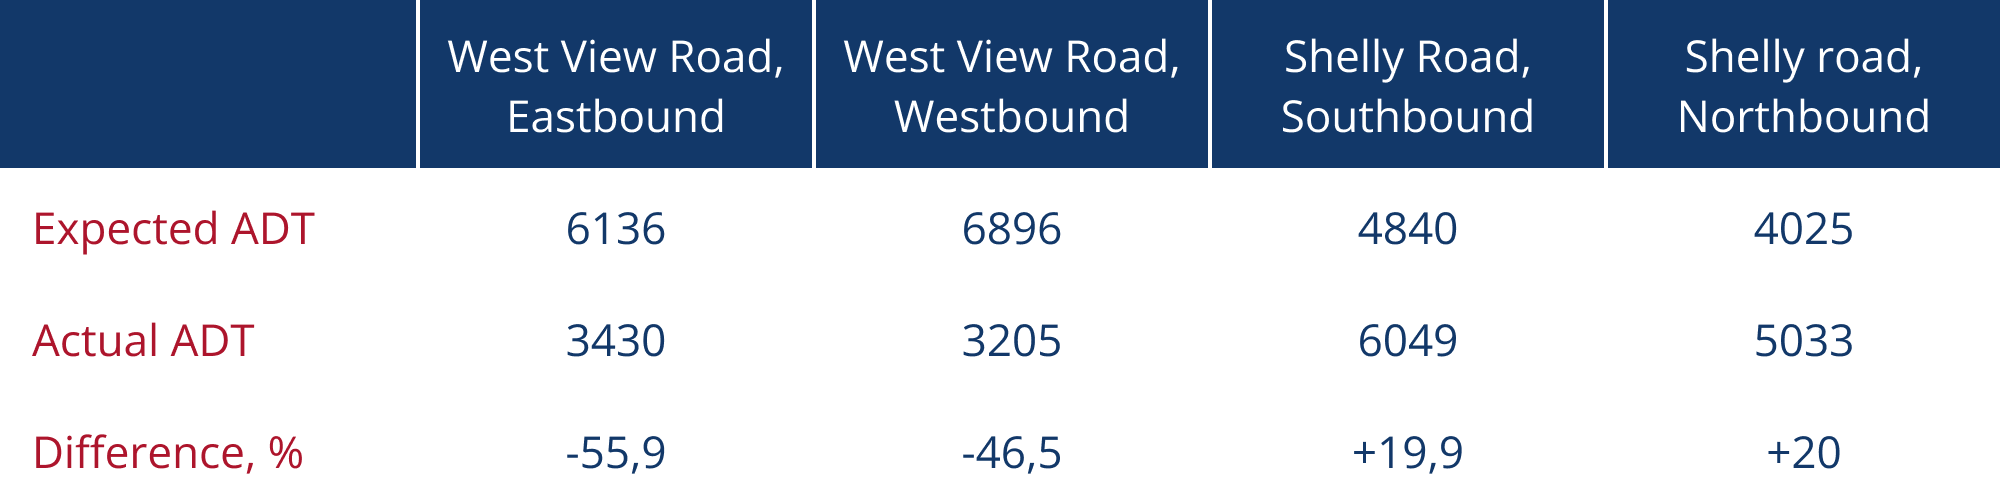
Thus, while on the closed road total ADT decreased by 51%, there was a traffic volume increase of 20% on the collocated road (Table 1).
Therefore, conducting a broader traffic flow analysis covering both primary and secondary roads can’t guarantee true traffic volume estimations at the site of interest. Thus, impact analysis must be an essential part of the site selection process. This ensures customers that a data provider has enough capabilities to discover, perceive and estimate the impact from road closures and, hence, can adjust expected AADT accordingly.
Part II. Sporting events
Sporting events, concerts, fairs, and festivals bring large crowds to specific locations, leading to changes in traffic flow, including increased traffic volume and congestion.
When conducting traffic analysis in such high-traffic areas, one must be aware of methods to use, and of their potential outcomes. Outdated methods of traffic volume estimations in this case may result in significant errors. For example, manual traffic counting relies on the visual observations and subjective judgments of an individual observer, covering only a limited time period of typically three to four consecutive days. This is a stark contrast to the more advanced, technology-driven methods of traffic data collection.
Partial time coverage and failure to account for external factors, such as special events, may result in incorrect estimations of traffic volumes. In the retail industry, using inaccurate data for site selection purposes could mean making costly network expansion mistakes in the new area. Utilizing modern traffic data analysis techniques with complete time coverage greatly enhances the accuracy of site selection process in new regions, effectively reducing the risks of making mistakes and mitigating the need for information about the area.
For instance, consider a company that relies on manual traffic counting to gather traffic volume data during a special event. One may say that traffic will change only on closely collocated to the place of event roads so estimations must be close to typical. But is it true?
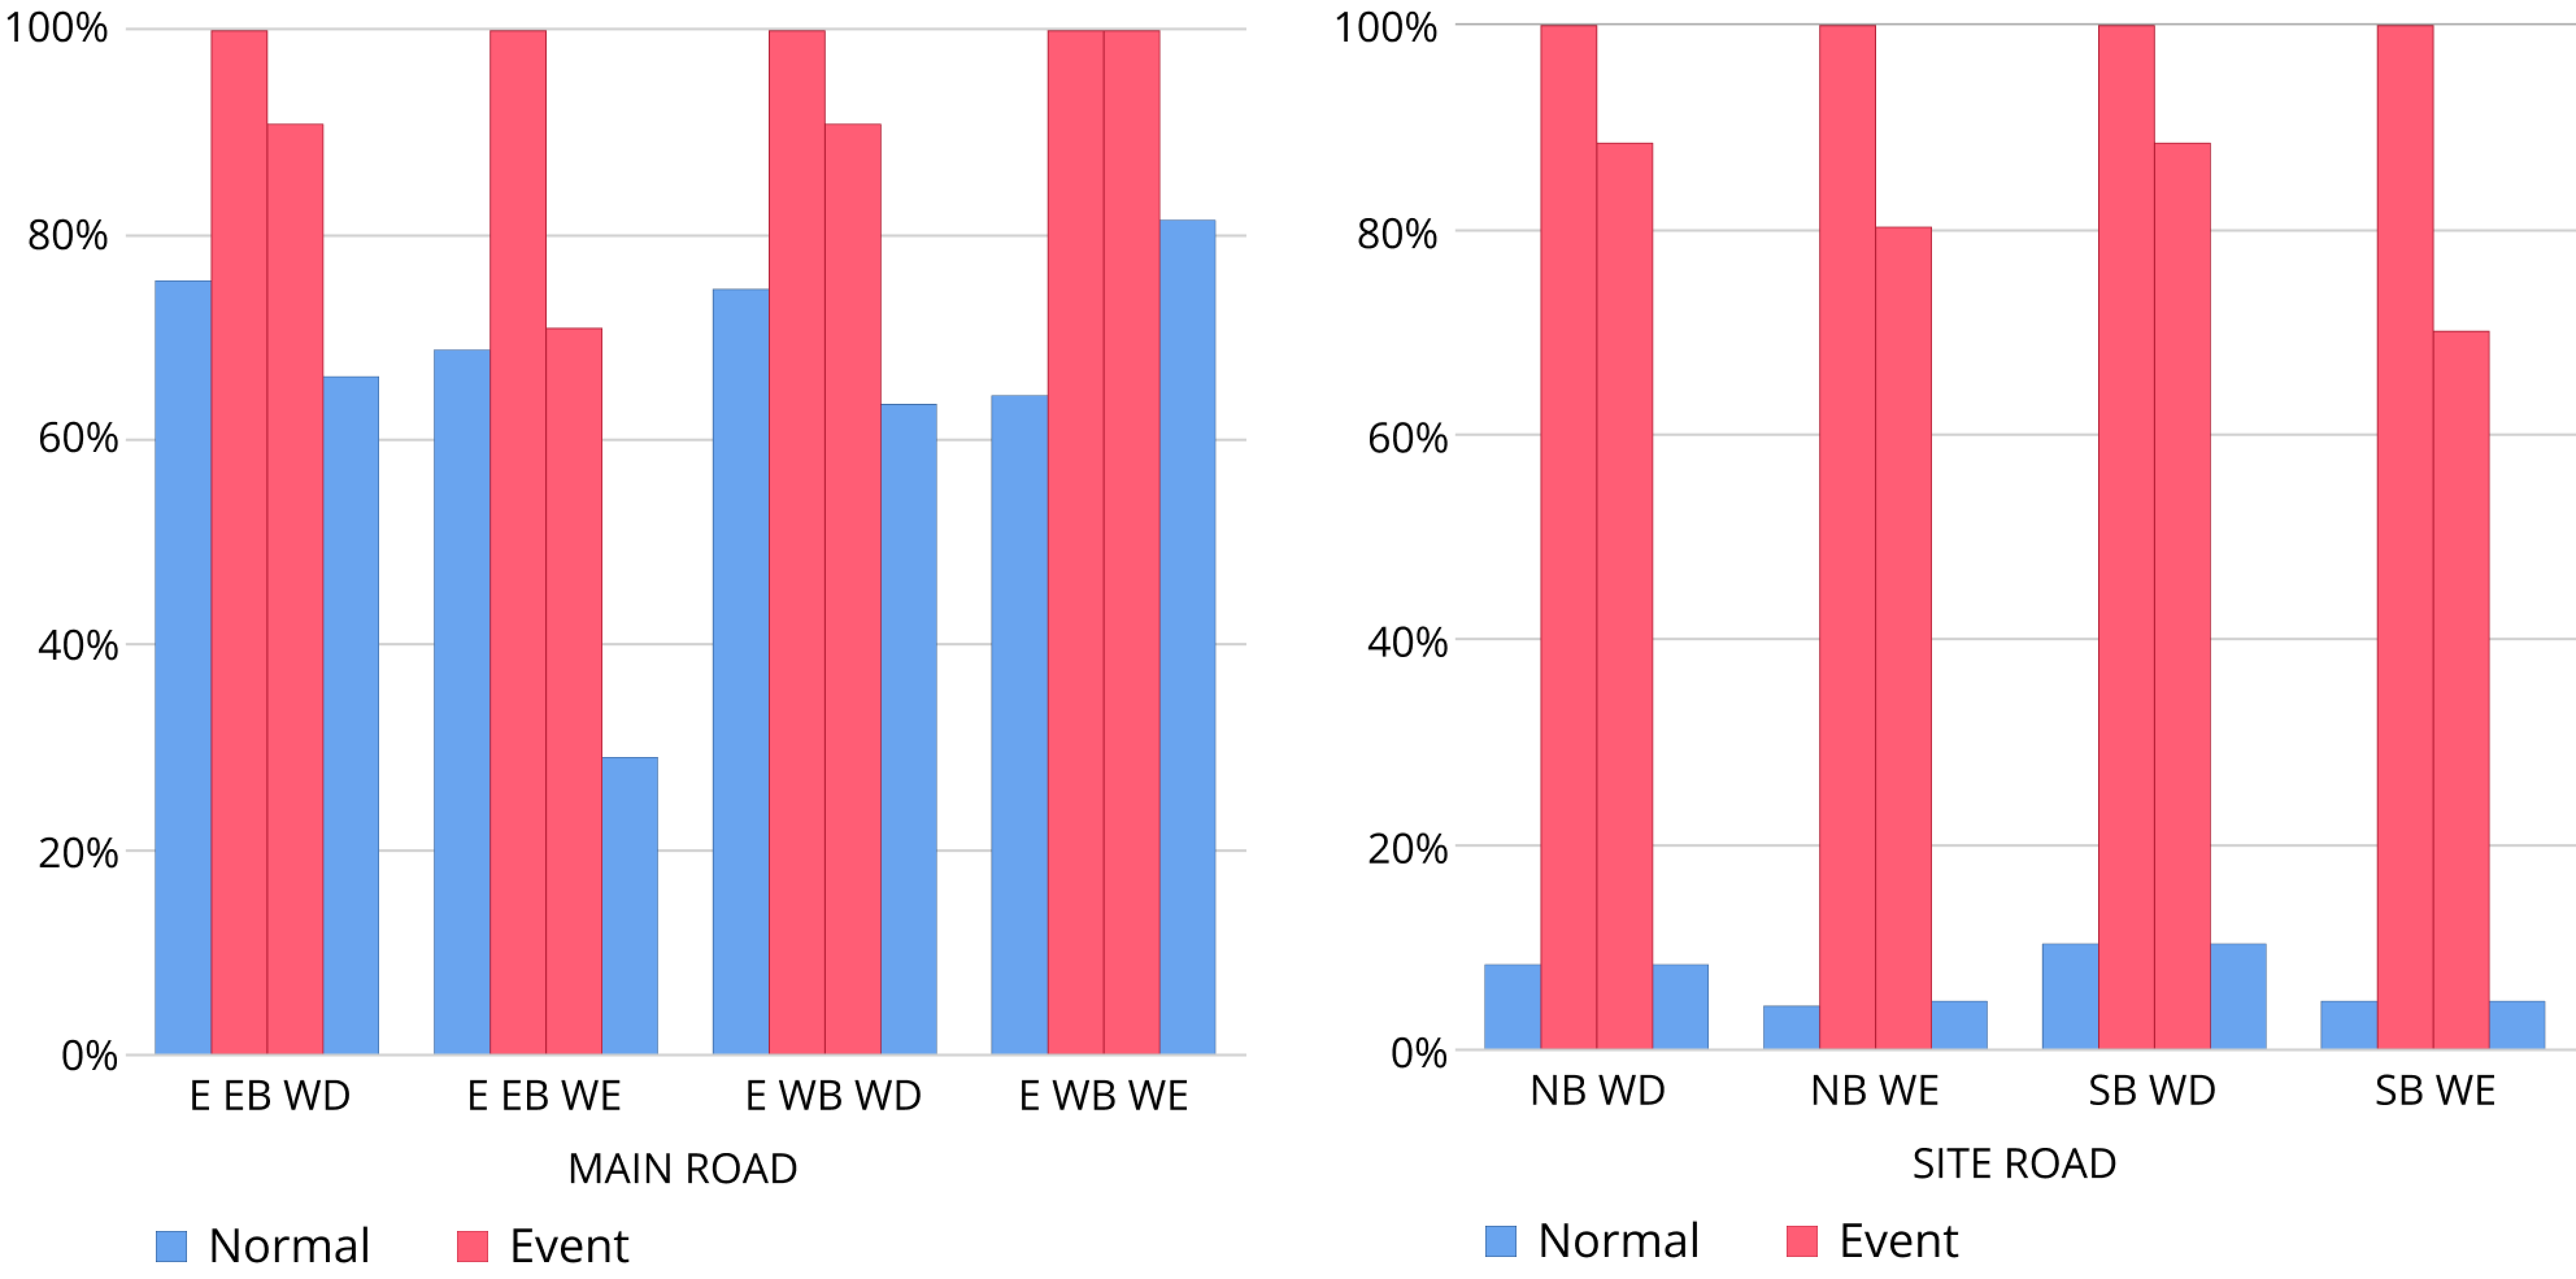
We analyzed traffic patterns on the road sections adjacent to the sporting facility to see how vehicle traffic will change under conditions of holding sporting events in the area (Table 2). Our study focused on a residential area with a population of 6000 that hosts a series of baseball games every July.
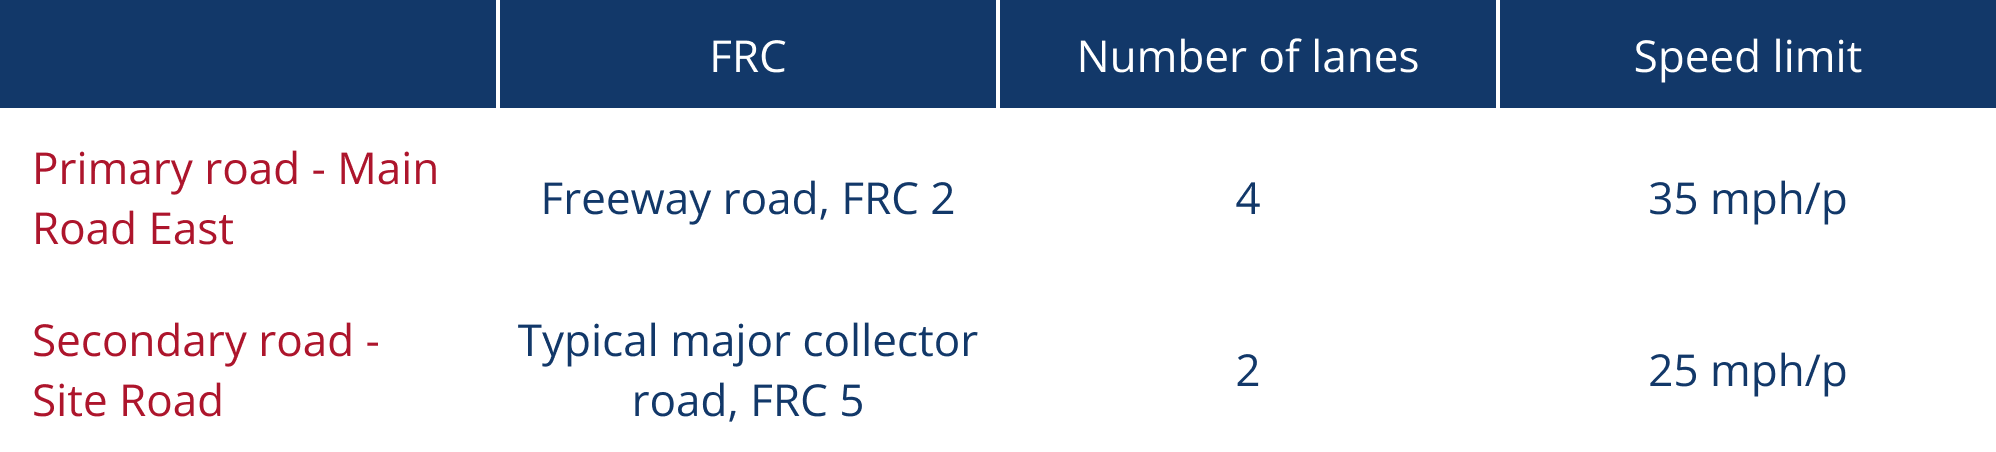
Figure 3 shows the evidence of traffic volume variations under normal conditions and when the special event takes place in the area. It is possible to see that the effect on traffic flow was the most pronounced during the two-weeks period in the middle of August. We found that such a considerable traffic volume increase coincides with the period of the event. In fact, traffic volumes increased by 20-40% on the Main Road, and by 60-90% on the Site Rd. Large number of people commuting from other areas to visit the two-week event contributed to a large increase in traffic volumes on the Site Road.
Overall, the presence of a professional sports team in a city can significantly impact local economic activity. This offers businesses a chance to take advantage of such events. For example, special discount offers for incoming fans, or additional business facilities along the route to a sports venue can positively impact the revenue.
Part III. COVID Impact
Introduction of stay-at-home measures during the COVID-19 pandemic had a substantial impact on traffic demand. During the first months of the pandemic, the number of vehicles on some roads diminished by up to 75% due to imposed restrictions.
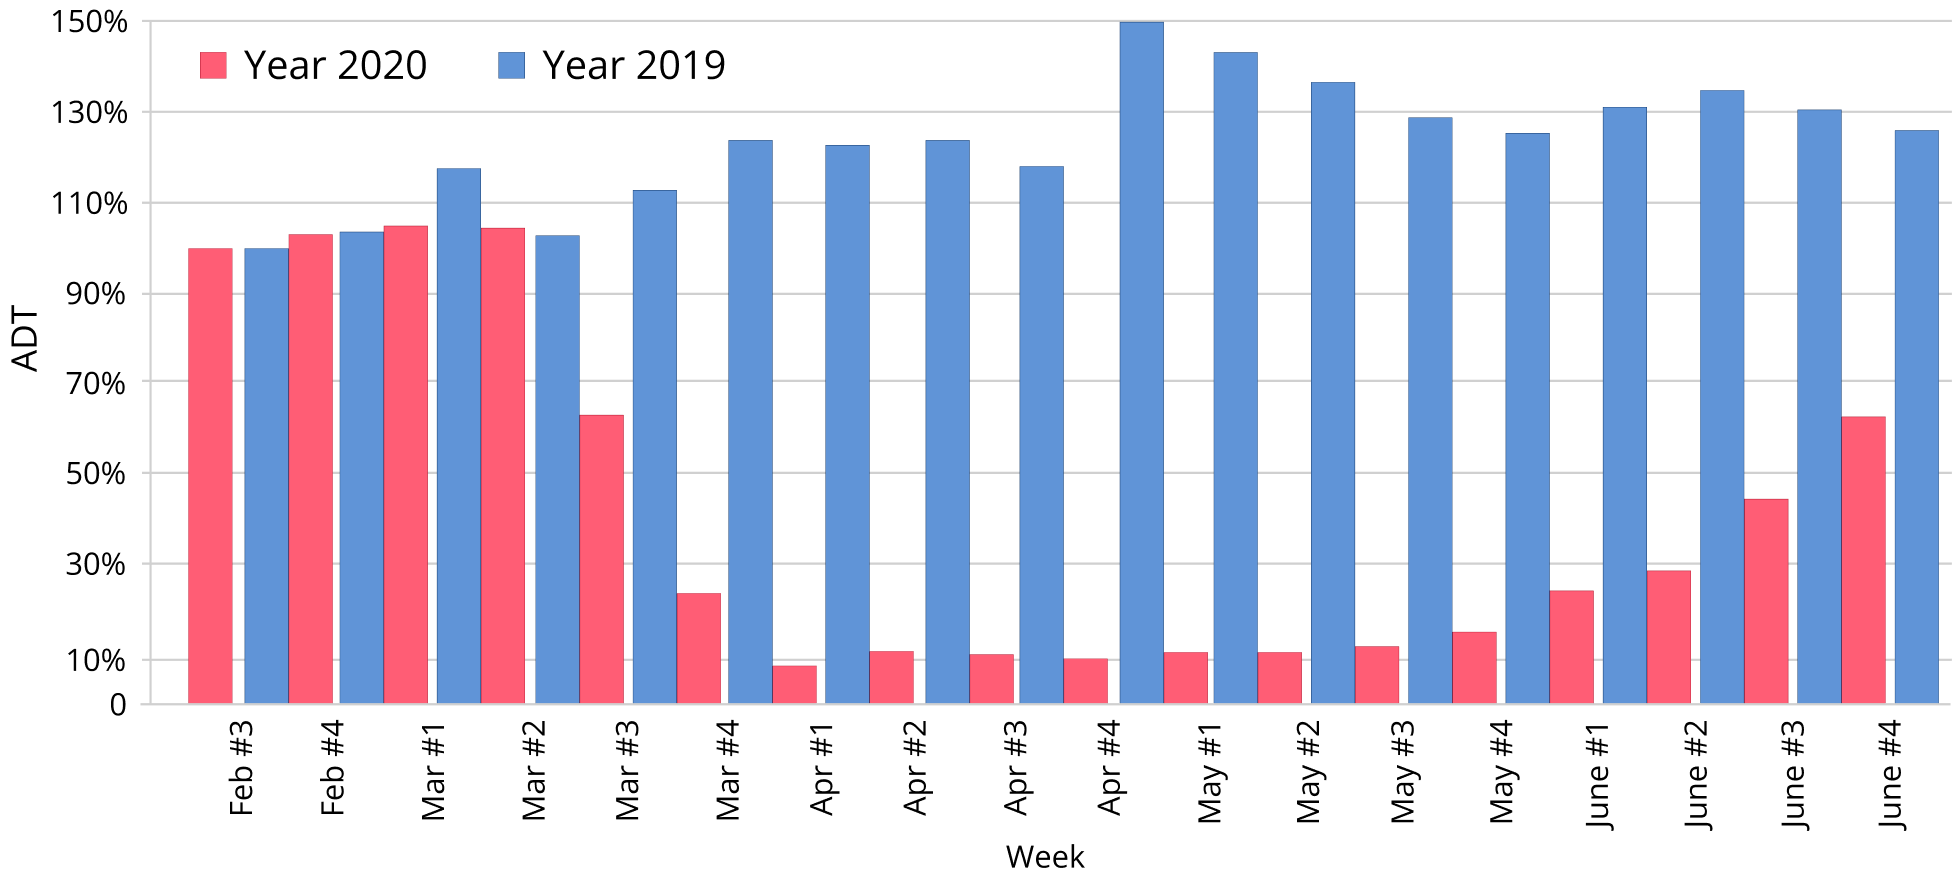
After the State of Massachusetts order went into effect on March 16, traffic flows started to decrease by about 30% per week. By the beginning of April, they were at 15% of those in February. After accounting for seasonality, traffic demands under the COVID restrictions did not exceed 10% of standard levels (Figure 4).
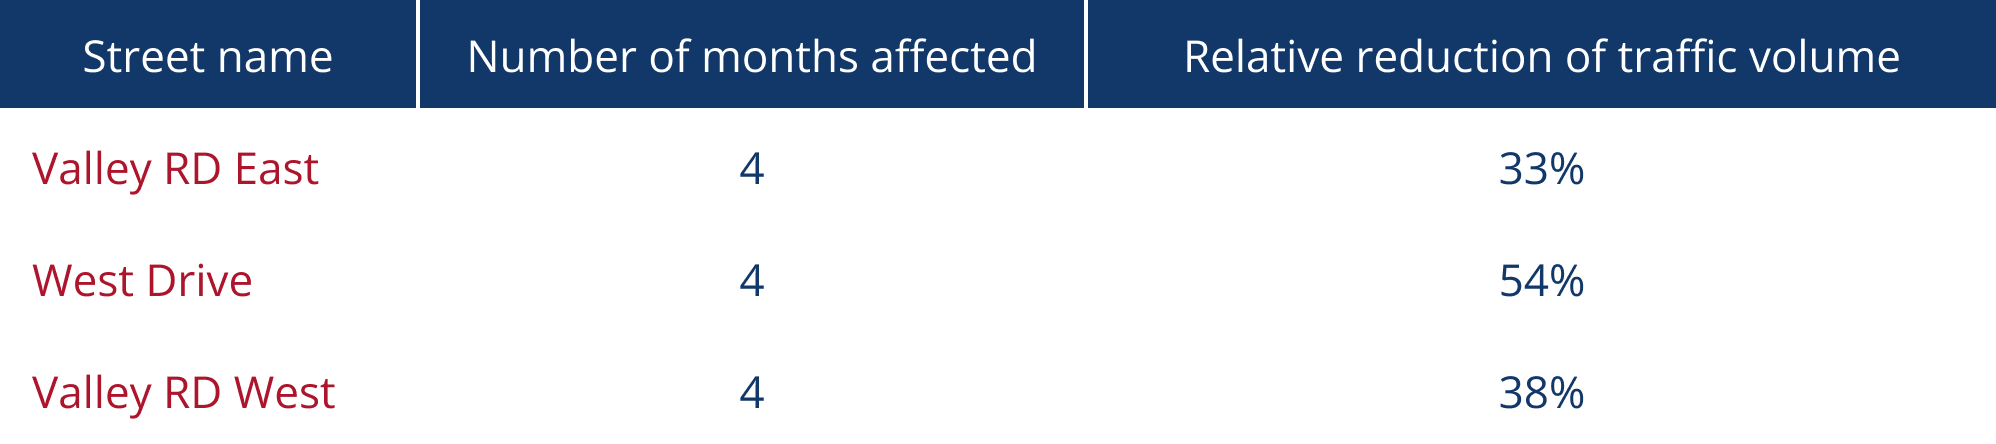
Analyzing the effect of COVID restrictions on typical minor arteries adjacent to a strip mall area, we noticed that traffic volume reduction varies within 33-54% (Table 3).
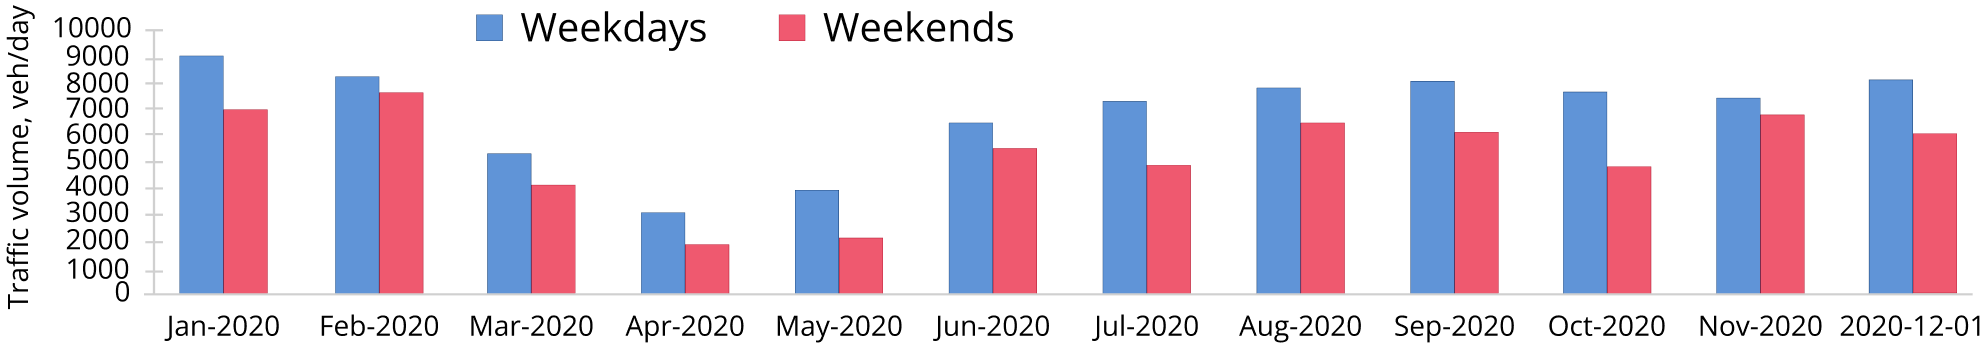
The largest effect has been seen on West Drive Road closely collocated with the shopping malls and bringing drivers to the parking lots (Figure 5). Since March 2020, traffic volumes were reduced approximately by half (54%), starting to recover to prior volumes only after 4 months. Thus, we can consider that the number of people going shopping in this area reduced by half due to imposed restrictions.
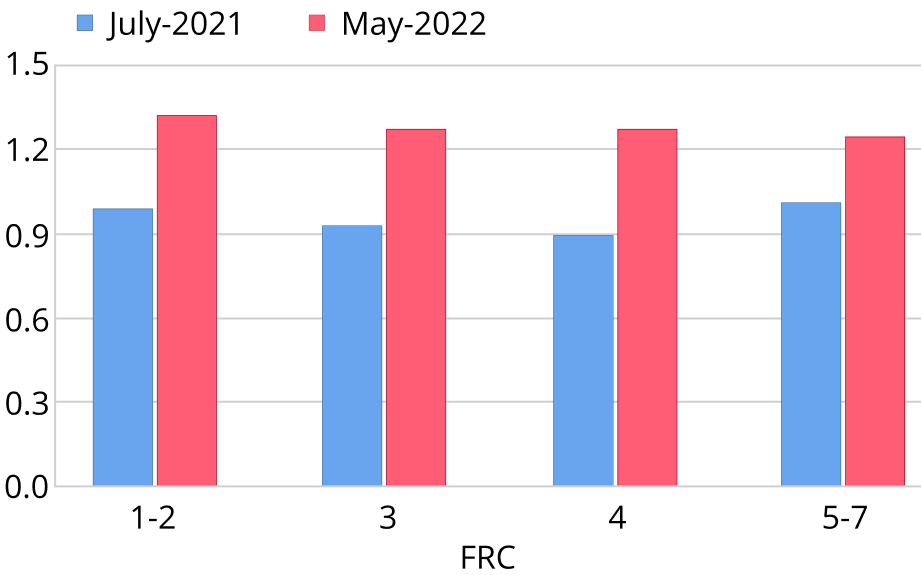
However, after the government lifted COVID restrictions, traffic volumes on American roads slightly increased, gradually reaching the pre-pandemic levels. To prove this statement, we selected 168 road sections of 26 sites located in four US states – Pennsylvania, Indiana, Kentucky, and Ohio. For each road section traffic data for the period from July 2021 to May 2022 had been collected. The data set comprises detectors information, 15-min bins GPS aggregated probe data, connected cars data, and traffic flow speed data for various roadway functional classes arranged in three categories – arterials, collectors, and local roads (FRC 1-2,3,4,5-7). All arrays had been analyzed by the Ticon algorithm, including the use of the dynamic speed/density model. Our results represent relative monthly ADT values for the research period – from July 1st 2021 to May 30th 2022 – with average ADT accounting for 1.
Results of our research show that traffic demand is increasing gradually, and at different rates in certain areas (Figure 6). On average, traffic demand increased from 0.93 in July 2021 to 1.25 in May 2022 for all roadway functional classes (Average TDG – 1.35; Median TDG – 1.34; TDG Standard Deviation – 0.06).
It was reasonable to expect that lifting of COVID restrictions would lead to an increase in traffic volumes. However, we noticed that average traffic demand estimates varied based on the type of road (Tab.4). The largest growth was observed on so-called “business roads” - highways and major arteries, while on small roads, the increase in mobility hasn’t been as significant.
On average, traffic demand increase is higher on weekends rather than on weekdays, and varies from 1.30 to 1.51 depending on the roadway functional class (Average TDG – 1.41; Median TDG – 1.42; TDG Standard Deviation – 0.08). On work days, mobility changes show variation from 1.27 to 1.40 (Average TDG – 1.32; Median TDG – 1.30; TDG Standard Deviation – 0.05). We suggest that traffic demand increase on weekends may be a result of rising non-working activity, including passenger car travel in US beach counties, shopping trips, holiday weekends’ travel, and others.

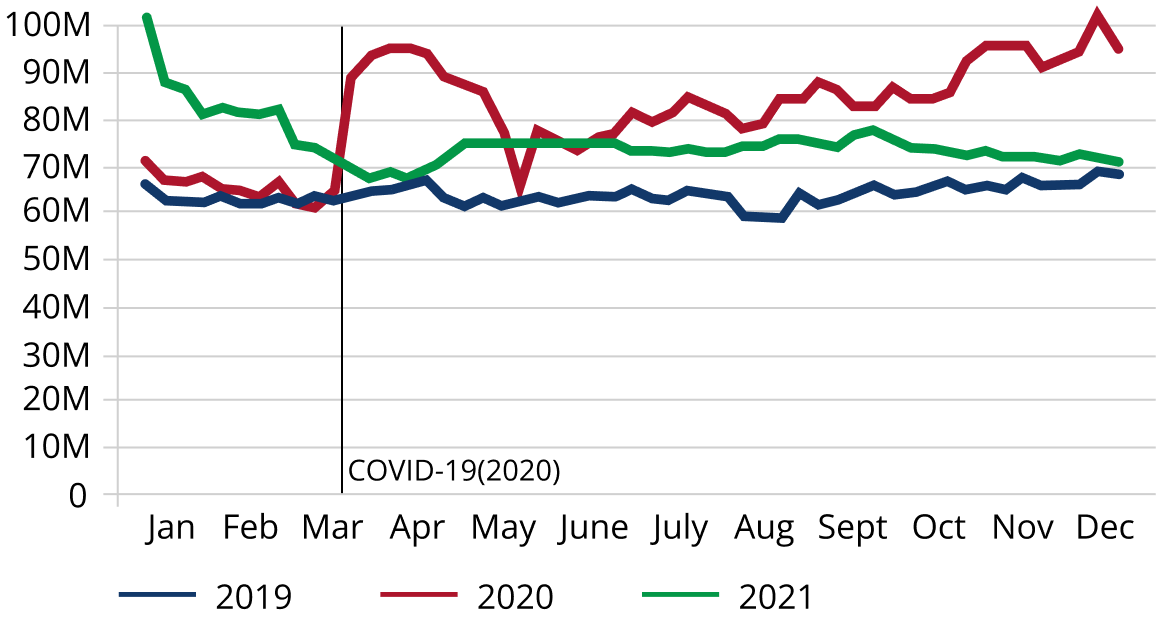
In fact, by the end of 2021, Americans started spending more time outside, reaching the pre-pandemic levels. According to the data provided by the Bureau of Transportation Statistics, the number of people staying at home at the end of 2021 was approximately 5% higher than in 2019 (Figure 7). For example, it was expected that nearly 42 million cars would travel 50 miles or more from home through the Fourth of July weekend, which is 1.1% higher than for the same period in 2019 (41.5 million).
Diving further, we saw that a number of investigated areas still haven’t seen significant changes in traffic demand through the period of observation. Our analysis found that 19% of explored road segments had an average traffic demand growth of 9% (Average TDG – 1.09; Median TDG – 1.12; TDG Standard Deviation – 0.1). Intraday traffic patterns in most of such areas strongly suggest a commuting type of mobility, with a huge increase for morning and/or evening peak hours during weekdays. Figure 8 shows typical intraday patterns for the road section of an artery in the Cincinnati metropolitan area that is congested throughout the year at around 8 am, with a significant number of cars moving at low speed. Thus, this observation suggests that this particular road is loaded mostly with work commuters.

Conclusion
Partial time coverage, use of one-size-fits-all data, failure to account external factors in traffic data analysis - missing these essential factors one can get wrong estimations of traffic volumes which, in fact, can lead to mistakes in business decision-making. Ticon methods of traffic data collection and analysis allows us to provide our clients with high-resolution datasets created on the base of year-round observations of traffic flow and cross-verification of multiple independent data sources. Our analysis allows us to identify alterations in traffic demand, specifically untypical traffic flow variations during a week, months, or a year. On the basis of data we provide and internal company information, your business can prognose ROI and optimize operations when it's needed the most.Therefore, instead of acquiring standard AADT numbers for a particular site of interest, we recommend ordering a broad traffic analysis including data about intra-day, intra-week, and monthly variations of traffic flow, drivers’ behavior, and demographics of local communities.