The Importance of Data Accuracy


As retail businesses increasingly leverage the use of big data in decision-making processes, the importance of data quality could sometimes be - erroneously - placed on the back burner. According to a recent Gartner survey, nearly 60% of companies don’t measure the cost of inaccurate data to their businesses. The survey also stated that on average organizations lose $15 million per year because of poor data quality.
Failing to acquire and leverage accurate data leads to a number of negative consequences including:
- Missed business growth opportunities
- Higher risks of making costly mistakes
- Lower ROI
In retail, it could mean making costly network expansions mistakes in the new area. And, selection of the perfect sites is not achieved just by getting more data. Unfortunately, businesses struggle to maintain data accuracy because they are primarily concerned with collecting more data rather than with the quality of the data they acquire.
Underestimating the importance of data quality may disrupt the operational efficiency of a business and negatively affect its ROI. In fact, the ROI of any data accuracy initiative is elusive. However, the cost of poor data is quite evident.
When choosing any data provider, it is vital to ensure that the data will be acquired:
- Exactly for a location of your interest - not for a ‘polygon, neighborhood or nearby street’
- For substantial period of time - not just in a couple of days or for ‘typical conditions’
- Up to date - not gathered several years ago
- Representing the whole traffic flow - not ‘a lot of cars’, ‘zillions of points’, or ‘important fleets’
And, last but not least, it is important to make sure that the data is verified.
Below we discuss some typical errors in data acquisition that are common to the industry.
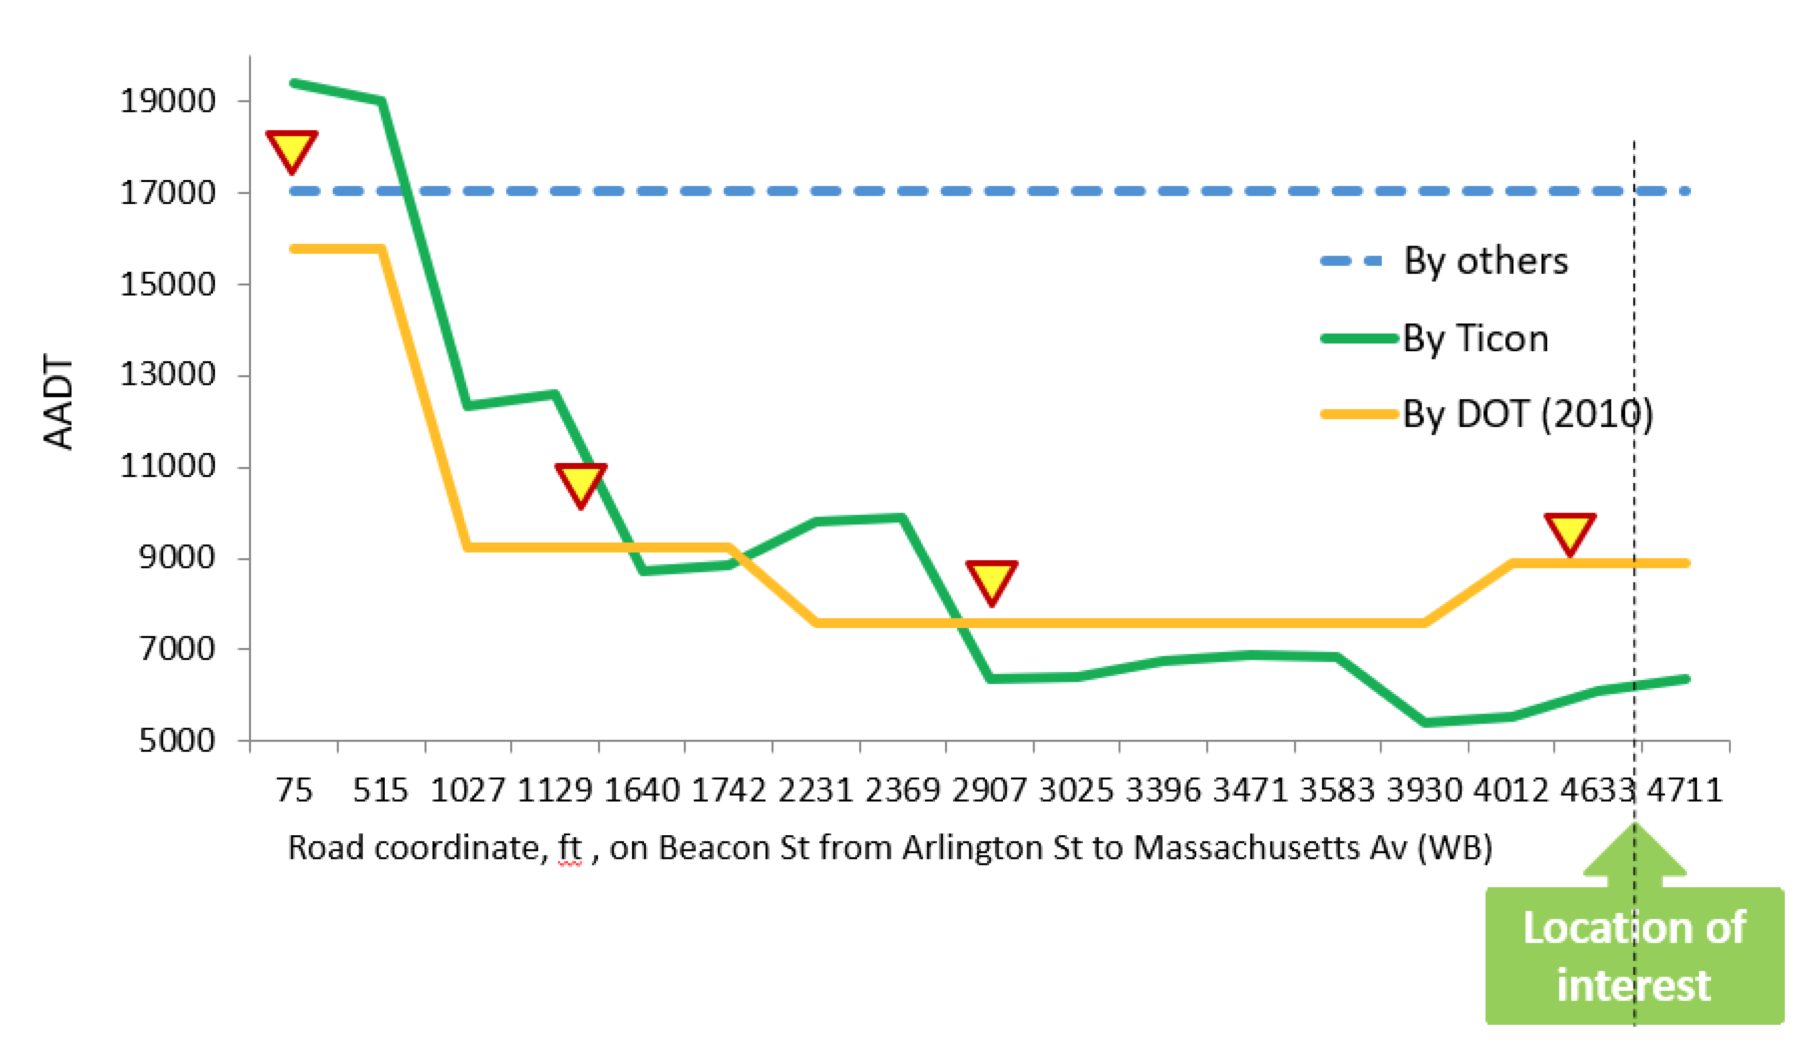
Low resolution is one of the key reasons why data can be misleading. In other words, usage of over-averaged data for the analysis of a particular location of interest might bring misleading results. Many providers deliver AADT value for long road segments a.k.a. TMC or even XD segments. It is a perfectly acceptable resolution for state-wide metrics but it’s far from ideal for site selection. Figure 1 shows how AADT can change over the road section of about 5000 ft. Here, over-averaging results may lead to a huge error (91%) for the analyzed location.
Another problem is caused by the detector hardware. Unlike other data providers treating traffic detector data as a ground truth, at Ticon we always verify the detector data, as it is known to be imperfect. Studies show that data sourced from even permanent traffic detectors must be verified, as traffic sensors might make mistakes detecting traffic volumes. These mistakes come from non-ideal turn-ups, wrong positioning of sensors, and - last but not least - regular malfunctioning of detectors themselves as well as their communication systems. Our analysis of 637 traffic sensors in terms of temporal coverage, data accuracy, and ampleness of information [1] had shown that nearly 17% of traffic sensors contain misleading observation data over the transportation networks (Table 1). In addition, almost half of the analyzed traffic sensors (44%) don’t provide full-coverage due non-optimal positions, poor turn-ups, and limited line of sight. In this particular environment it can be attributed to tight urban conditions that cause an error in sensor positioning.

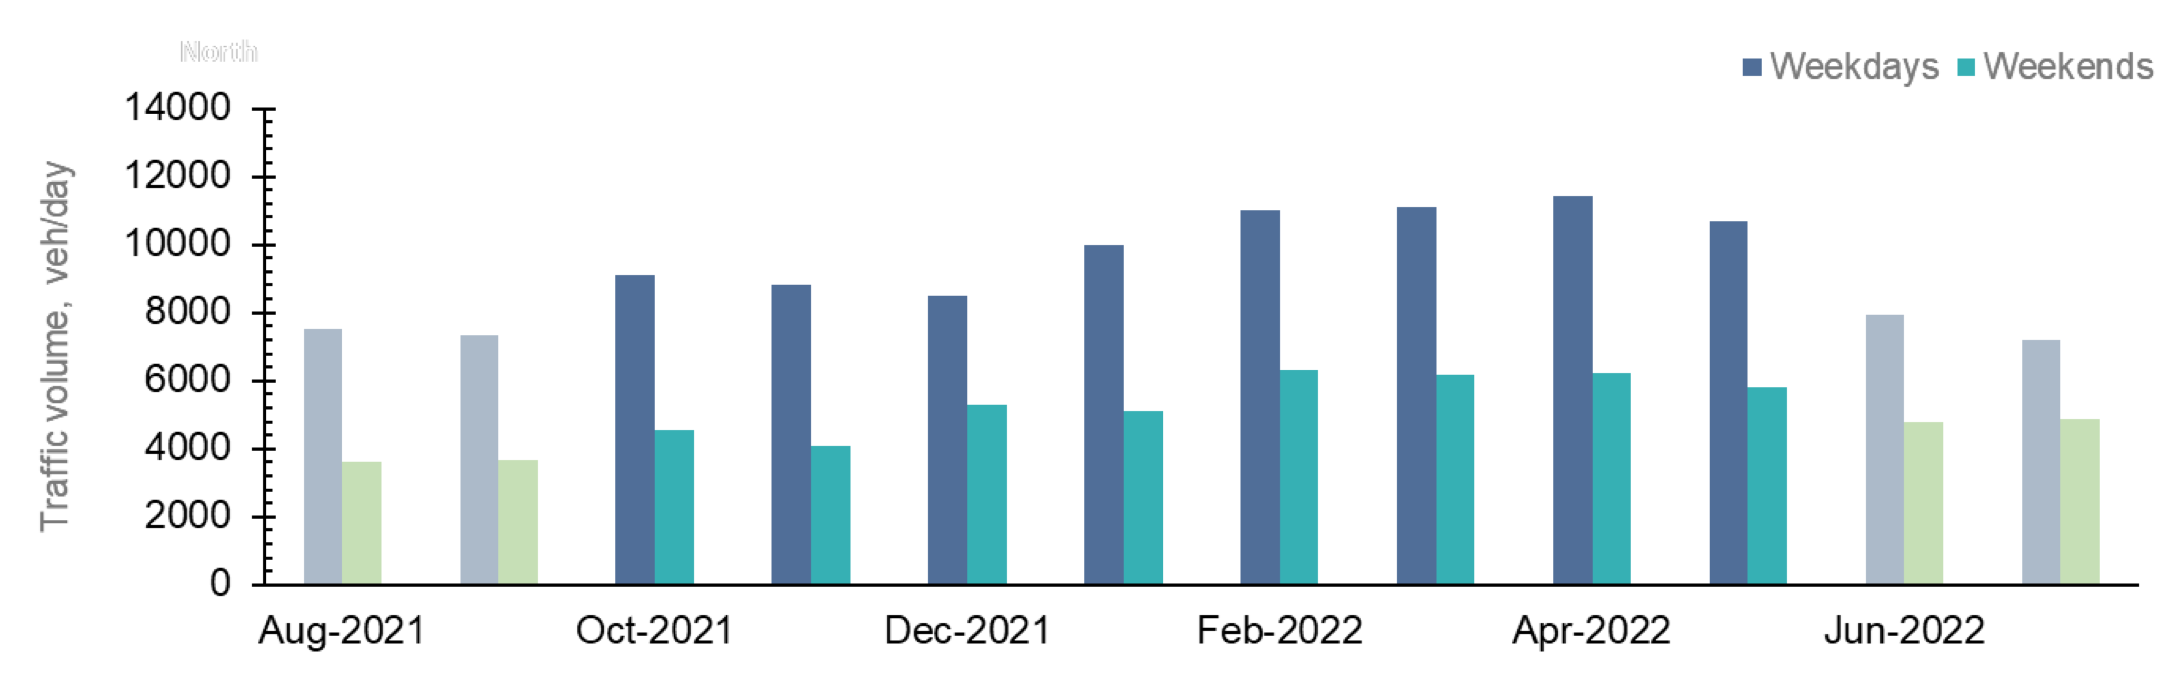
Short time of observation, which is limited to 2-7 days for most portable detectors, a.k.a. “counters”, presents another problem, a more substantial one, as more seasonal traffic fluctuation is expected. In some areas, traffic volumes may considerably vary from onemonth to the next. Yet as Figure 2 shows, there is a decrease in traffic levels starting from June till October indicating the outflow of the number of drivers during the summer months.
There might be multiple reasons explaining seasonal fluctuations of traffic flow. If we know specifics of the investigated location, e.g. vocational or study area, we may predict how traffic will change depending on the season. However, the more complicated task is to predict the exact number of vehicles driven by the certain site.
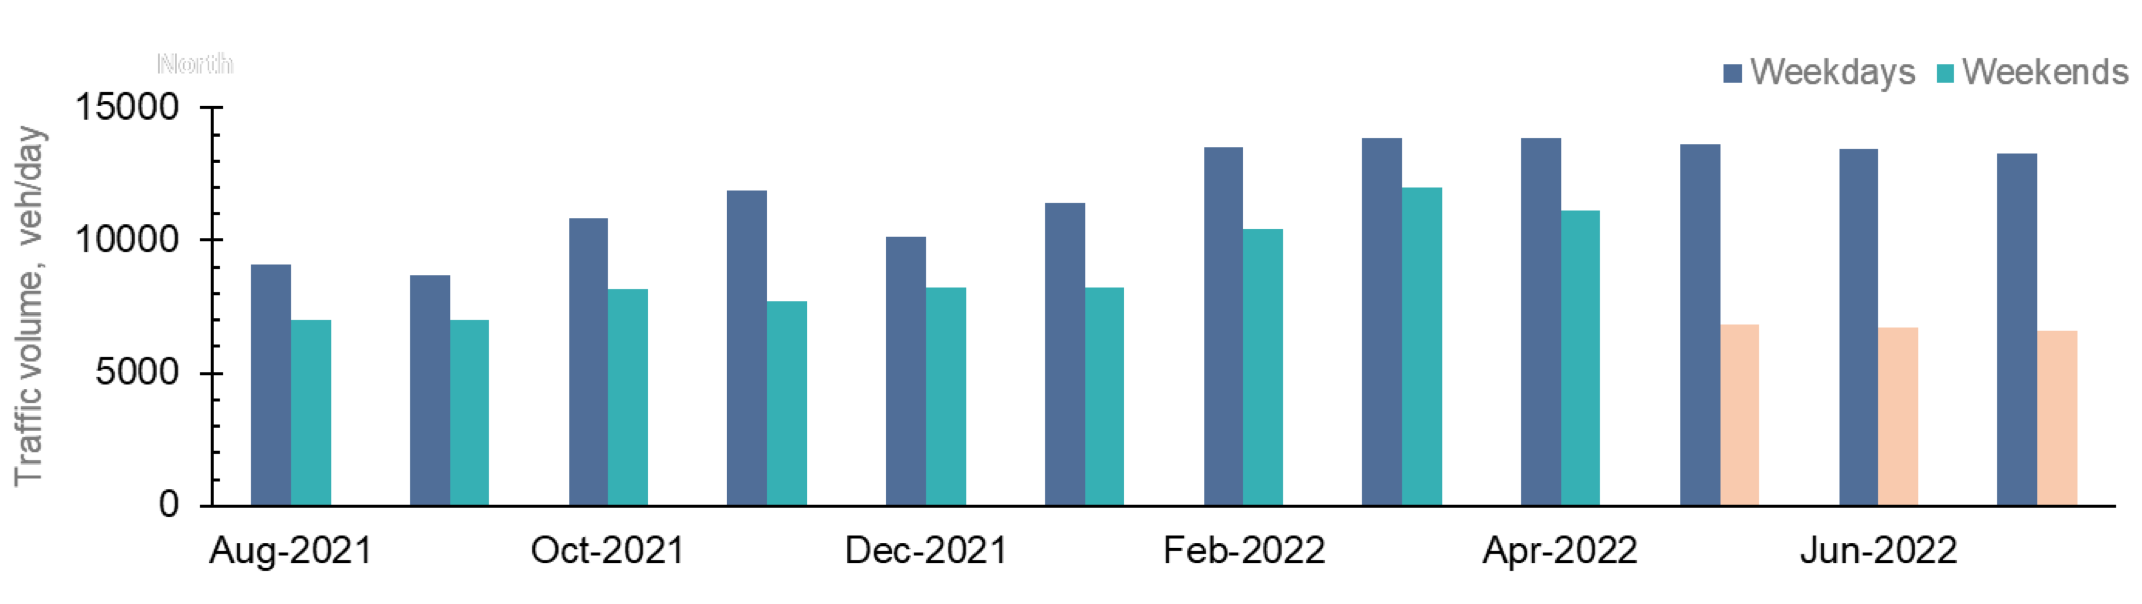
The presence of typical seasonal fluctuations at any site does not mean that its traffic patterns will be the same as everywhere else. As presented in Figure 3, seasonal fluctuations of traffic flow have a similar pattern to those presented in the abovementioned chart. But we may see that traffic activity is much higher during weekends which affects the development and growth aspects of the business.
Thus, leveraging data collected by portable sensors for a short period of time as a ground truth might result in wrong decisions in the course of your site selection process. Study on “Variability in traffic monitoring data” [1] also stresses the importance of proper adjustment of the short-term monitored data to account for monthly or at least seasonal fluctuations.
Nevertheless, attempts to make an adjustment based on historical data will always be poorer in quality than leverage of data from year-round observations collected for a particular site. 21st-century methods and technologies make it possible to carry out such observations without excessive spending of resources. And we do it for our clients!
In Ticon, we assure the reliability of our information by:
- Cross-verification of multiple-sourced traffic data
- Using high-resolution traffic data sources
- Continuous year-round observation of the exact area of your interest
- using only the data highly relevant to traffic flows
Hundred people traveling in one bus will serve as a great example for understanding the problem with the use of partially relevant data, like cellular phones, a.k.a. LBS.
When your business complements its institutional and technical expertise with our C- Site InsightTM intelligence reports derived from accurate data, you can make confident decisions about site selection, identify the best locations for network expansion, and reduce the risks of making costly mistakes.
References:
VARIABILITY IN TRAFFIC MONITORING DATA: FINAL SUMMARY REPORT