Changes in traffic demand during the recovery from pandemic


A recent report on Traffic Volume Trends released by the U.S. Federal Highway Administration (FHWA) stated that total vehicle miles traveled (VMT) slightly increased, gradually reaching the pre-pandemic levels. VMT increased across all US roads and streets by +4.1% in January 2022 compared to the same month last year. In addition, VMT percentage change varies from region to region. Car activity was higher in the West (7%), North-Central (4.5%), and South-Atlantic (3.9%) regions, compared to only 2.7% and 2% increases in North-East and South-Gulf areas during the same period in 2021 [1].
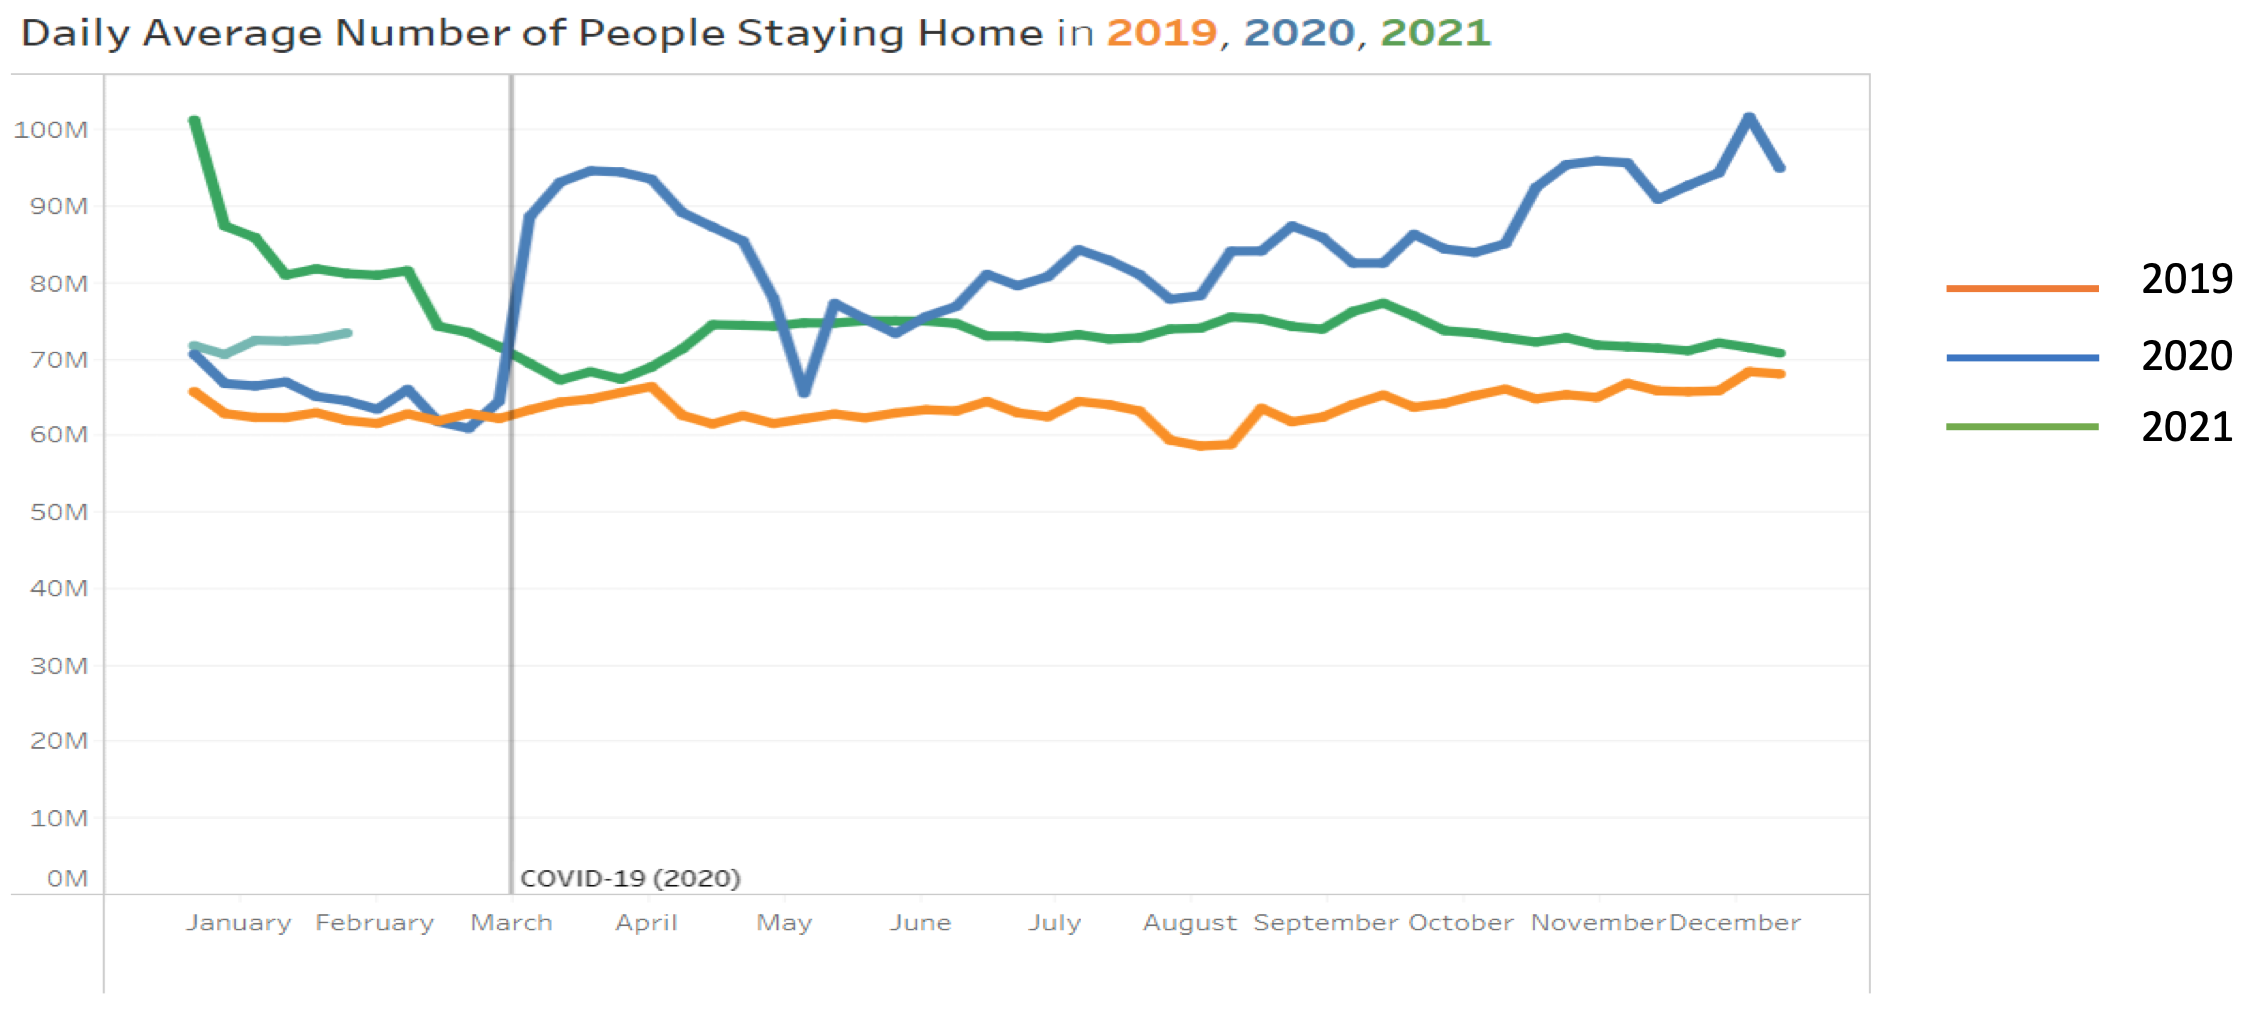
With increasing mobility, there is a parallel reduction in the number of people staying at home. By the end of 2021, Americans started spending more time outside reaching the pre-pandemic levels. According to the data provided by the Bureau of Transportation Statistics, the number of people staying at home at the end of 2021 was approximately 5% higher than in 2019 (Figure 1) [3]. For example, it was expected that nearly 42 million cars would travel 50 miles or more from home through the Fourth of July weekend, which is 1.1% higher than for the same period in 2019 (41.5 million) [2].
Being experts in traffic analysis and transport engineering, we know that using one-size-fits-all data may not perform well across all road segments and lead to mistakes in decision-making. Our findings reveal the importance of specific quantitative performance tailored toward every separate area due to differences in traffic volumes and demographic patterns.
Thus, with Americans being back on the roads after several coronavirus lockdowns that kept them homebound, the goal of this case study was to discover real changes in traffic demands, mobility patterns, and corresponding drivers’ behavior across various areas of the US and understand how these changes may influence business decisions in site selection and operation.
Key findings
- Traffic demand slightly increased all over the country. In many areas, though, the increase was more pronounced and even reached 19% and up since the end of 2021. The peak growth has been especially noticeable during the last three months of the research period (July 2021 – May 2022).
This volatility necessitates traffic analysis of the exact location of interest for accurate decision-making. - In the areas with a more pronounced increase in traffic, mobility demand has been higher during weekends rather than on workdays which is an indication of advanced growth of “non-working” activity.
Methodology
For the purposes of this research, we selected 168 road sections of 26 sites located in four US states – Pennsylvania, Indiana, Kentucky, and Ohio. For each road section traffic data for the period from July 2021 to May 2022 had been collected. The data set comprises detectors information, 15-min bins GPS aggregated probe data, connected cars data, and traffic flow speed data for various roadway functional classes arranged in three categories – arterials, collectors, and local roads (FRC 1-2,3,4,5-7). All arrays had been analyzed by Ticon algorithm, including the use of the dynamic speed/density model. Our results represent relative monthly ADT values for the research period – from July 01st 2021 to May 30th 2022 – with average ADT accounting for 1.
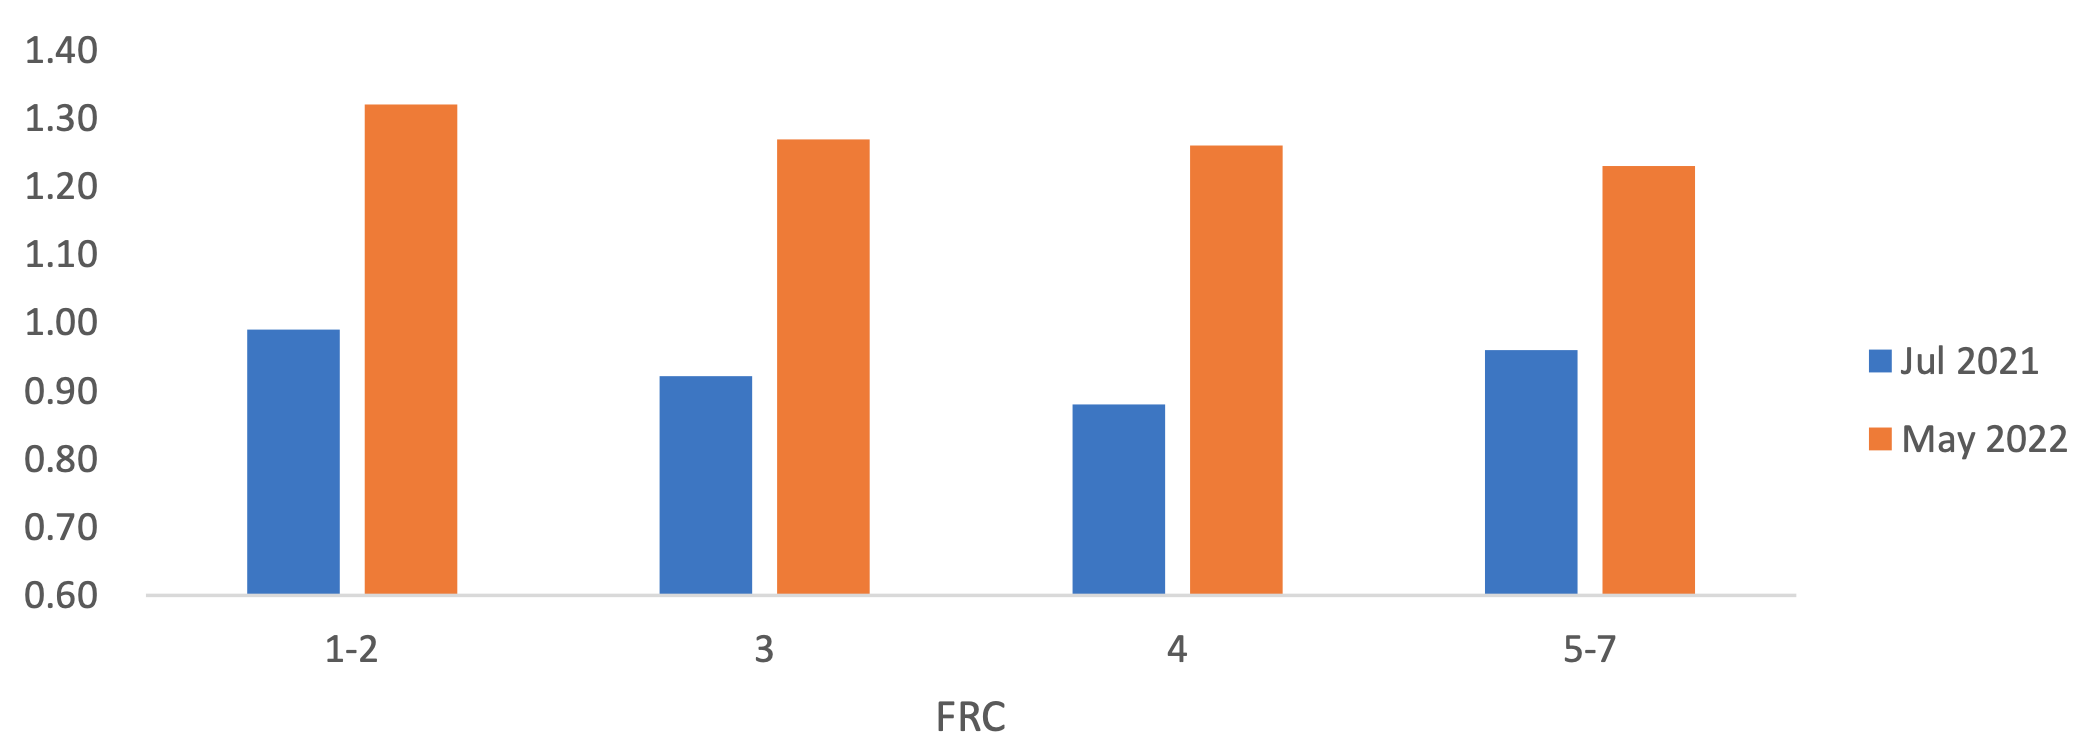
During the COVID-19 pandemic, the number of vehicles on the roads substantially diminished due to stay-at-home orders. However, in the last few months, traffic has rebounded and outpaced pandemic levels in some areas of the US. Results of our research show that traffic demand is increasing gradually and at different rates in certain areas (Figure 2). On average, traffic demand increased from 0,93 in July 2021 to 1.25 in May 2022 for all roadway functional classes (Average TDG – 1.35; Median TDG – 1.34; TDG Standard Deviation – 0.06).
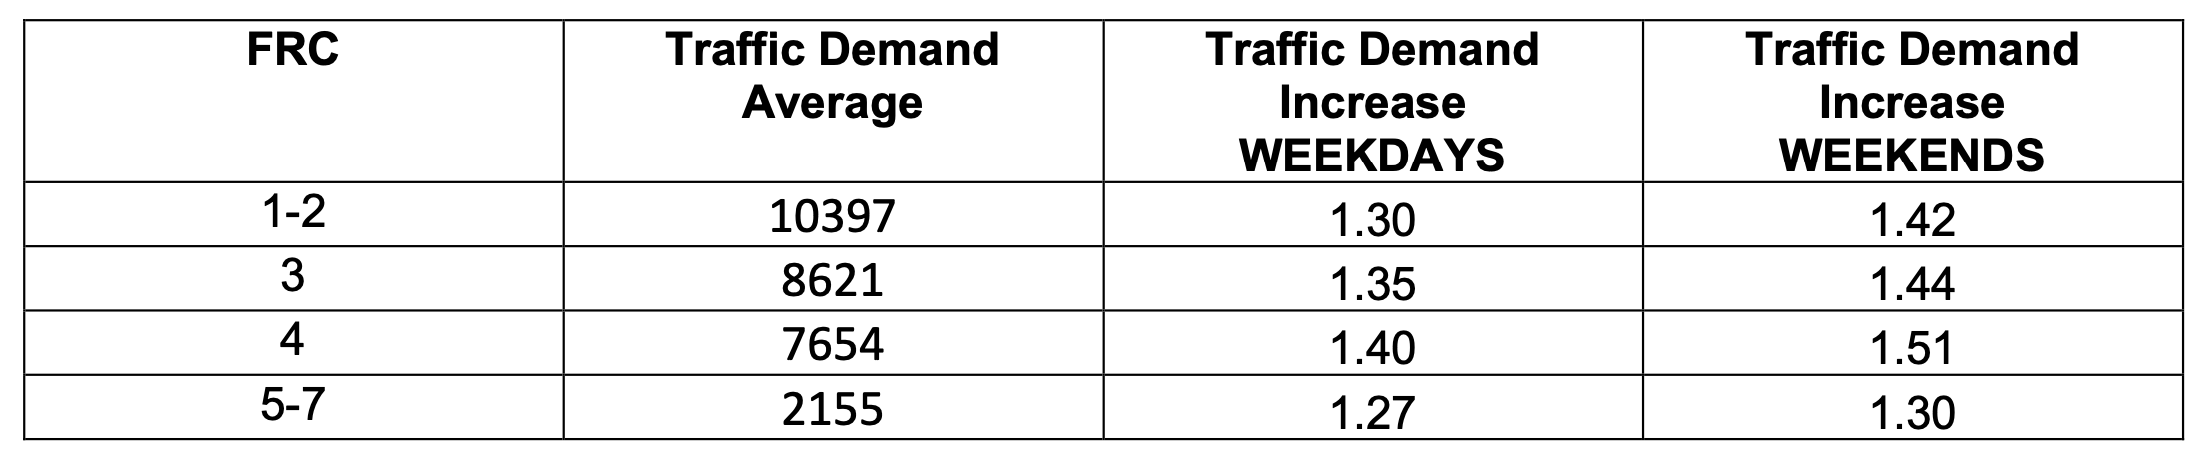
It was reasonable to expect that lifting of COVID restrictions will lead to an increase in traffic volumes. However, we noticed that average traffic demand estimates varied based on the type of road (Table 1). The largest growth is observed on so-called “business roads” - highways and major arteries, while on small roads increase in mobility hasn’t been as significant.
On average, traffic demand increase is higher on weekends rather than on weekdays, and varies from 1.30 to 1.51 depending on the roadway functional class (Average TDG – 1.41; Median TDG – 1.42; TDG Standard Deviation – 0.08). On working days, mobility changes show variation from 1.27 to 1.40 (Average TDG – 1.32; Median TDG – 1.30; TDG Standard Deviation – 0.05). We suggest that traffic demand increase on weekends may be a result of rising non-working activity including passenger car travel in US beach counties, shopping trips, holiday weekends’ travel, and others.
Diving further, we saw that a number of investigated areas still haven’t seen significant changes in traffic demand through the period. Our analysis found that 19% of explored road segments had an average traffic demand growth of 9% (Average TDG – 1.09; Median TDG – 1.12; TDG Standard Deviation – 0.1). Intraday traffic patterns in most of such areas strongly suggest a commuting type of mobility, with a huge increase for morning and/or evening peak hours during weekdays.
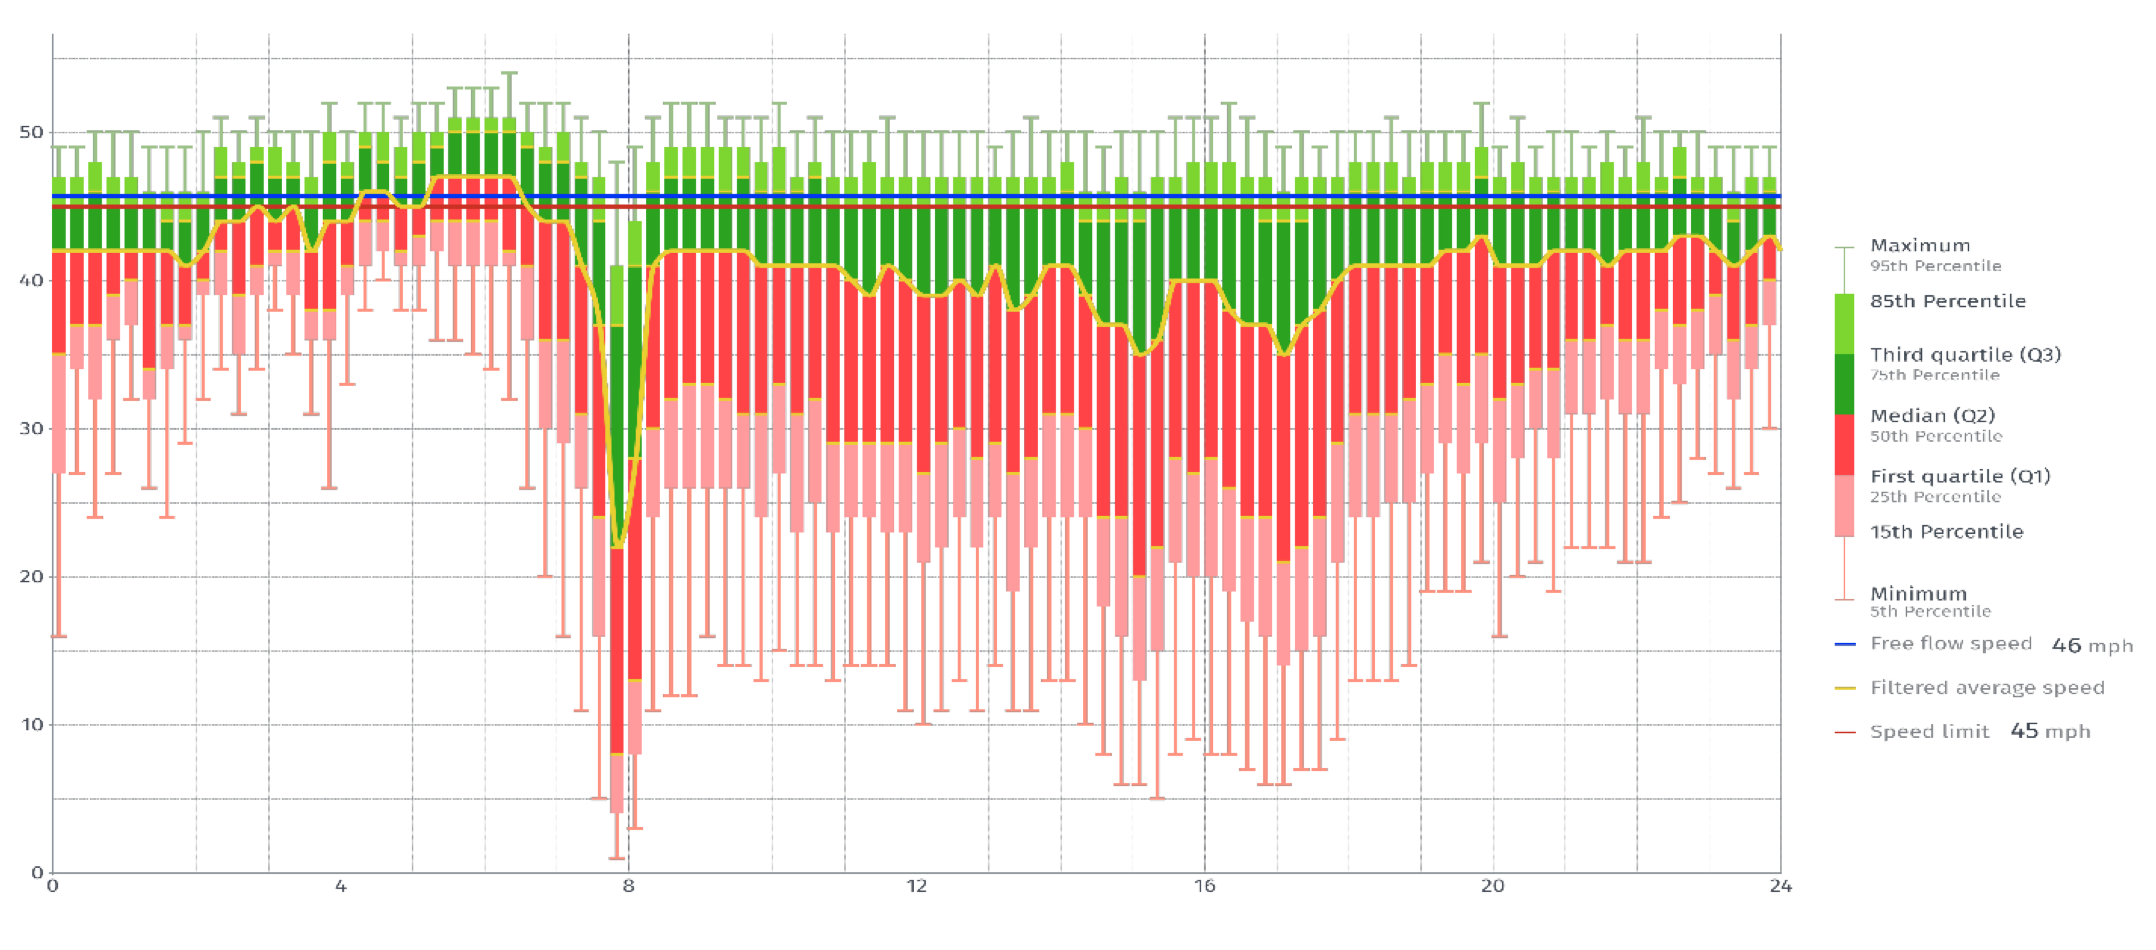
Some road sections that haven’t experienced significant changes in traffic demand have familiar peak hours throughout the year as commuters participate in traffic during a certain time every day, largely following traditional work hours. Figure 3 shows typical intraday patterns for the road section of an artery in the Cincinnati metropolitan area that is congested throughout the year at around 8 am, with a significant number of cars moving at low speed. Thus, this observation suggests that this particular road is loaded mostly with working commutes.
Conclusions
- Even though FHWA estimated that VMT increased across all US roads and streets by +4.1% in January 2022 compared to the same month last year, the percentage change may significantly vary within states, counties, and what is important, between specific locations in one area due to the number of reasons, from thelifting of COVID-19 restrictions to specific drivers’ behavior and certain area conditions. The average traffic demand increase across all examined transit areas was 9%. In contrast, average traffic demand is surging in shopping areas, accounting for 50% and even more. On average traffic flows increased by 35% across all roads and areas of our sample. It is necessary to stress that most of the studied areas are located near important arteries and business roads.
- The most significant traffic demand growth falls on weekends which is an indication of the growing non-working activity of the population, and strong intentions to spend time outdoors, visiting public places, and local points of interest.
- Results of our research show that some areas experience regular traffic patterns without any substantial changes in traffic demand, which makes it important to explore traffic patterns in specific areas apart from general assumptions.
References
Policy and Governmental Affairs Office of Highway Policy Information: January 2022 Traffic Volume Trends
Bureau of Transportation Statistics: Latest Weekly COVID-19 Transportation Statistics
From Sea to Shining Sea: AAA Predicts 47.9 Million People Will Travel This July 4th