Pharma-Site Insight: Leveraging Health and Traffic Big Data


The US drugstore industry is undergoing revolutionary changes that force the major players to explore innovative tools for network restructuring, which is necessary to remain viable and competitive in the coming years. CVS, in particular, is revamping its retail strategy and embracing three new distinct store models1, in addition to its traditional stores:
- Locations that offer primary care services
- "HealthHub" stores that have on-site dieticians, nurse practitioners and lab services
- On-site treatment for chronic conditions such as diabetes and asthma
The number of store visits remains one of the key indicators of store performance. This indicator in large degree depends on accurate selection of the store location with the right amount of convenient access and traffic volumes on nearby streets and travel intentions of the drivers.
In addition to conventional traffic analysis, which Ticon does with unsurpassed accuracy in its C-Site Insight product, pivoting and leaning into healthcare aspects of the business demands a multi-faceted approach to meet consumers where they are. Knowledge of customers located nearby is essential for the enterprise in the selection of a distinct model of a store as some of the “HealthHub” stores might be transformed into destination places.
Ticon provides information on the competitive landscape of the site of your interest for accurate decision-making on destination places. Information on competitive landscapes includes data on the degree of saturation of the area with similar services.
Data provided by Ticon is mined from high-quality and reliable sources to enhance the business benefits for a client. In combination with other integrated data sourced by the customer, it would streamline the decision-making process for analysts to create accurate judgement on the site selection. We provide the data solutions, but it always takes your expertise to make the executive decisions.
Upon considering these reasons, Ticon determined the need to explore the possibilities that Big Data and new hardware-free technologies provide to data-driven solutions for the selection of new distinct drugstore business models.
The following Case Study had been conducted as a Proof of Concept.
Executive Summary
For the Case Study we selected 12 random existing CVS locations in the state of Pennsylvania. The comparison was based on five factors: (1) Chronic diseases prevalence (for this example we have chosen diabetes as the most common chronic disease in the country)2, (2) Population density, (3) Household income, (4) Traffic patterns, and (5) Driver behaviour. The goal of the analysis is to conclude which operating CVS stores would be more suitable and profitable to transform to the“HealthHub” stores, and which stores may show better growth within existing business models.
Table 1 presents the primary metrics for all selected stores. One can see significant variations in values of influencing factors among these randomly chosen stores.
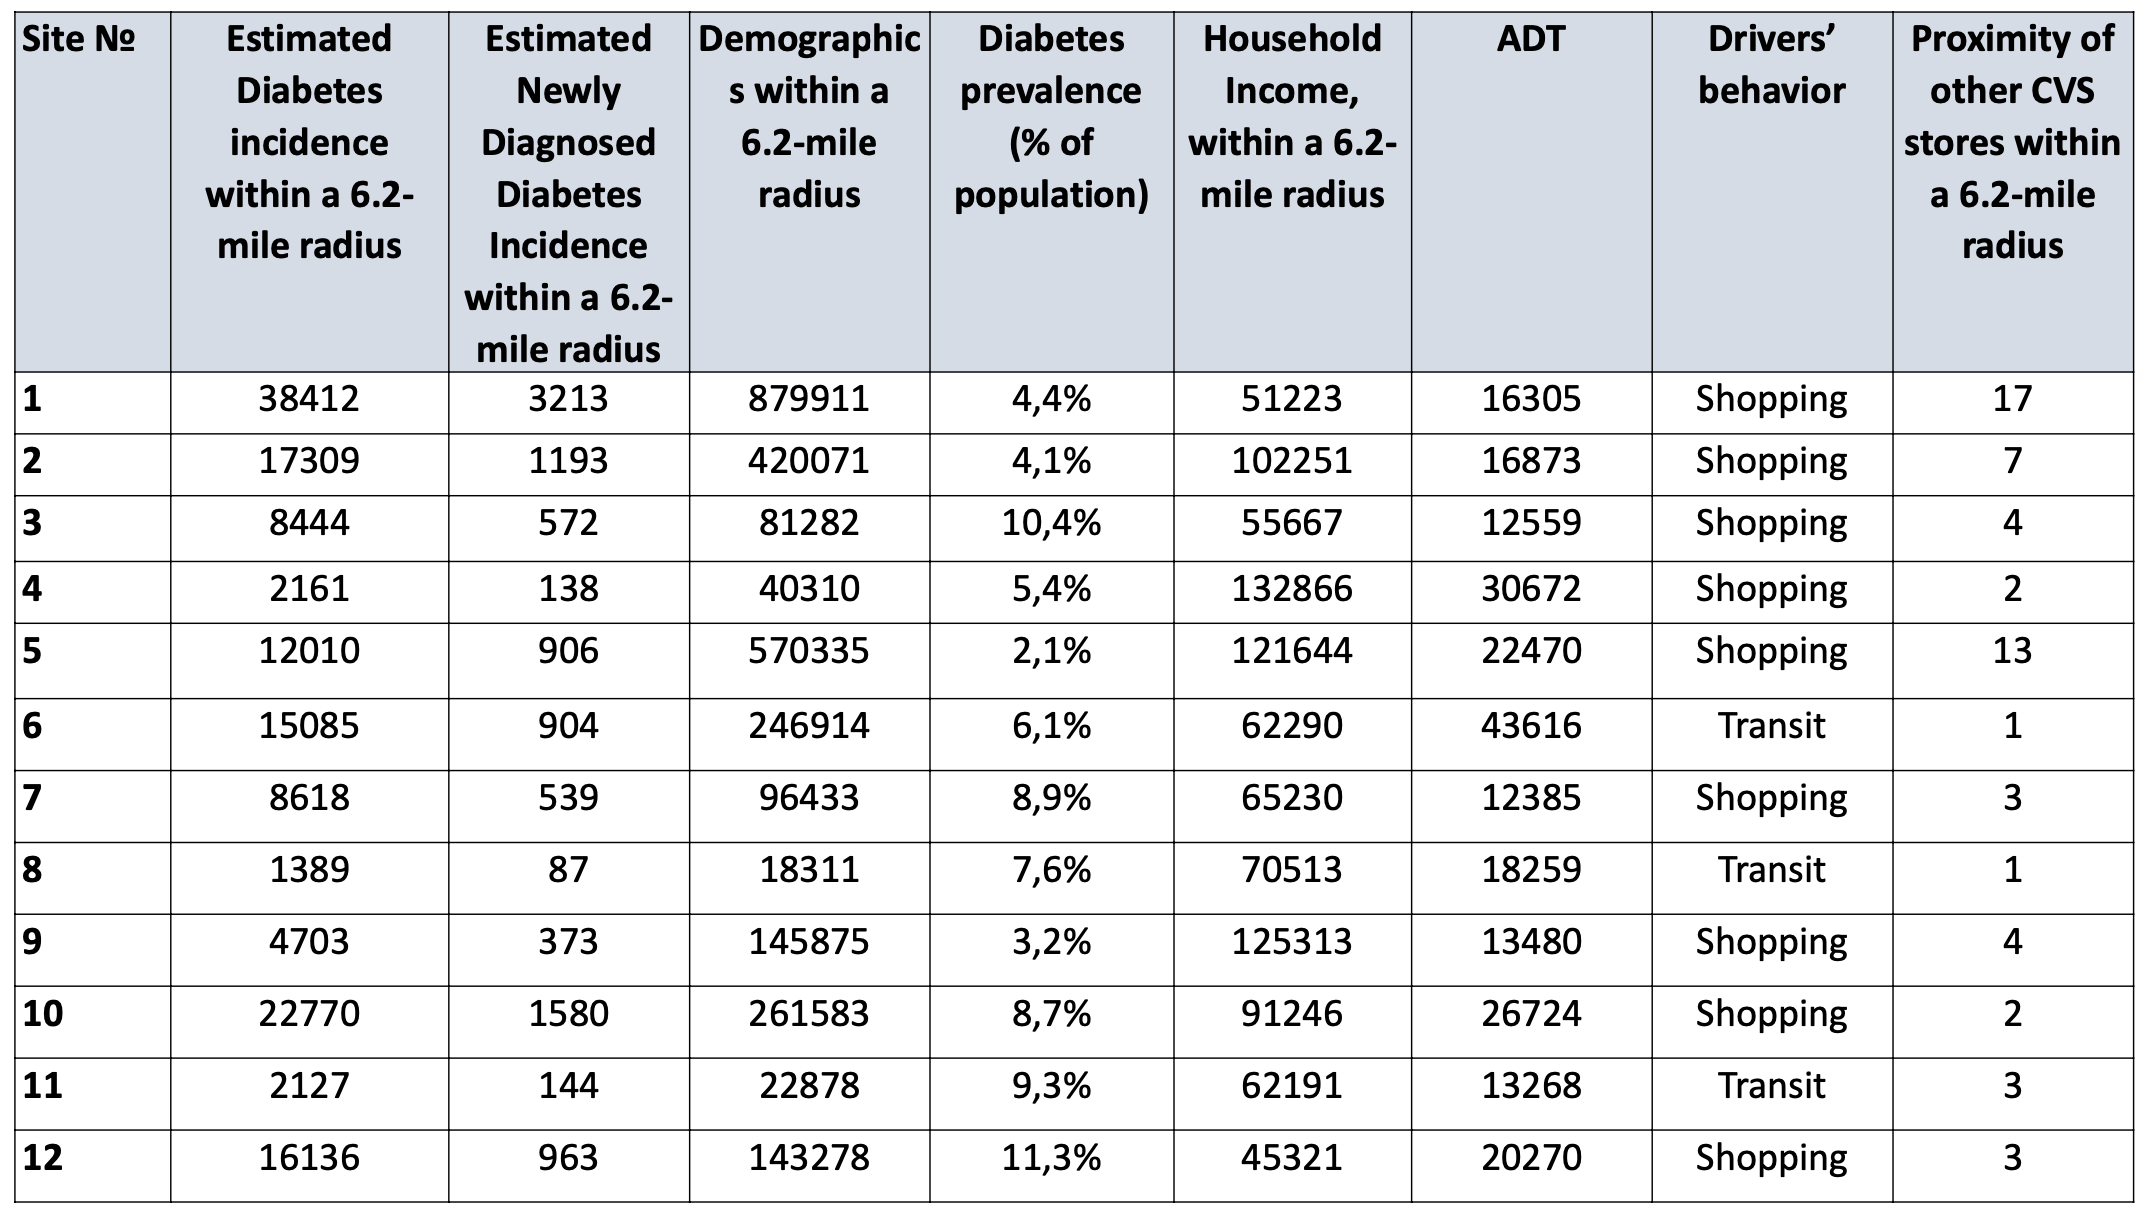
As the mission of CVS hubs is to expand regular and routine medical access, particularly for people with chronic illnesses, the chronic disease prevalence in close proximity to drugstores becomes an essential parameter of the customer base (Figure 1). Knowledge of population health is vital for consumer-centric business strategy promoted by the CVS. For this case study, we have selected diabetes. However, Ticon technology supports mining data on other health conditions of interests.
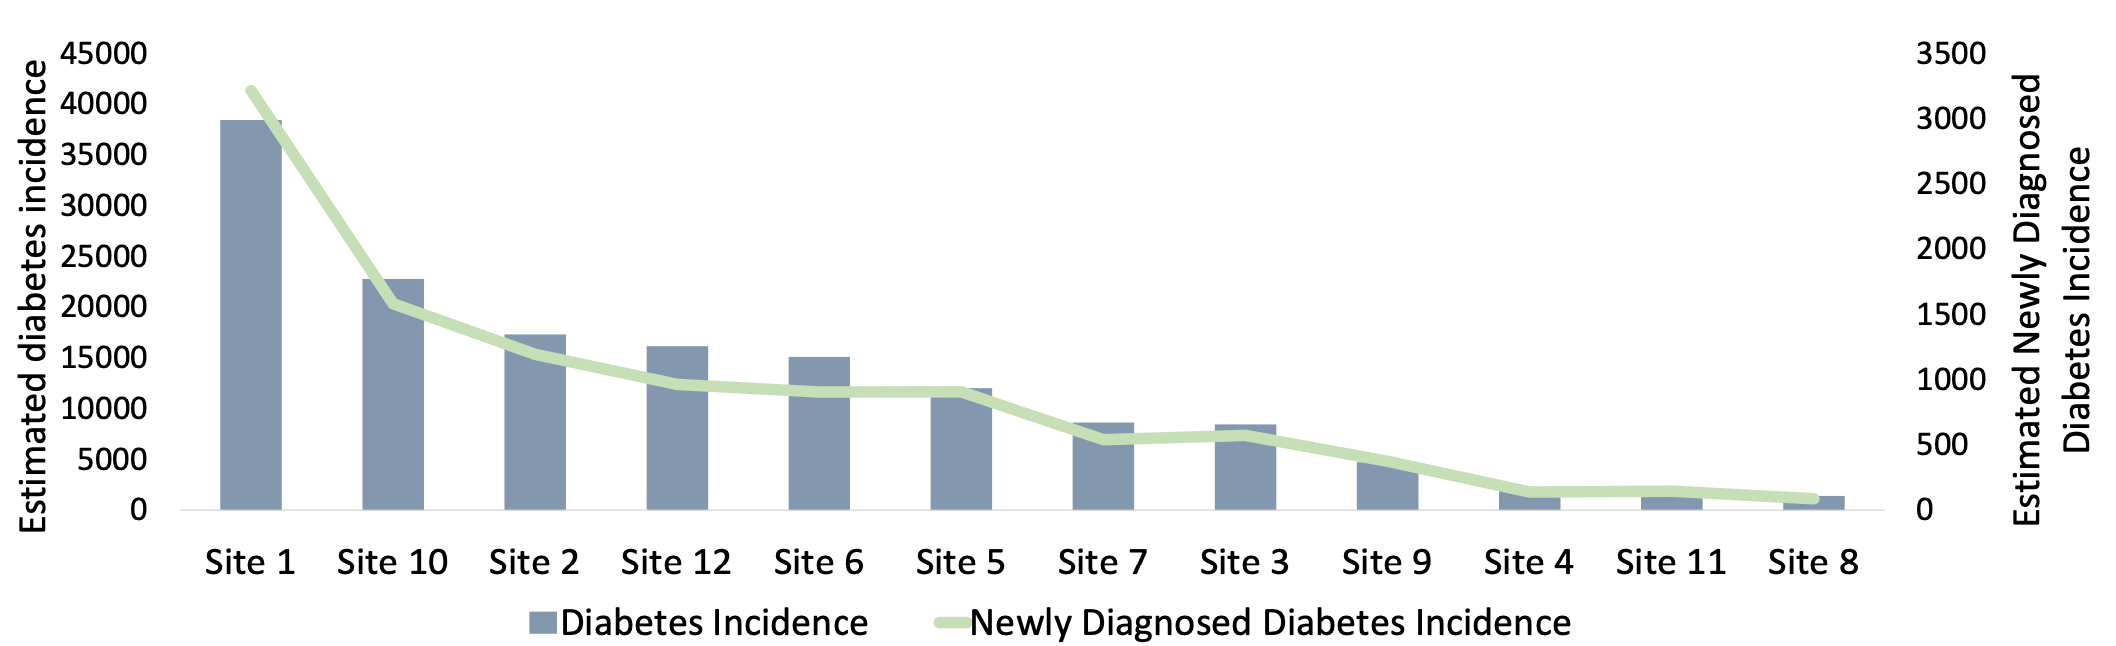
According to Figure 1, it is possible to assume that Site 1 having the largest estimated chronic diseases incidence around is the best location for the transformation into a “HealthHub” store. However, to confirm such an assumption, it is necessary to conduct a more complex and detailed analysis of all influencing factors.
Site analysis
Site 1
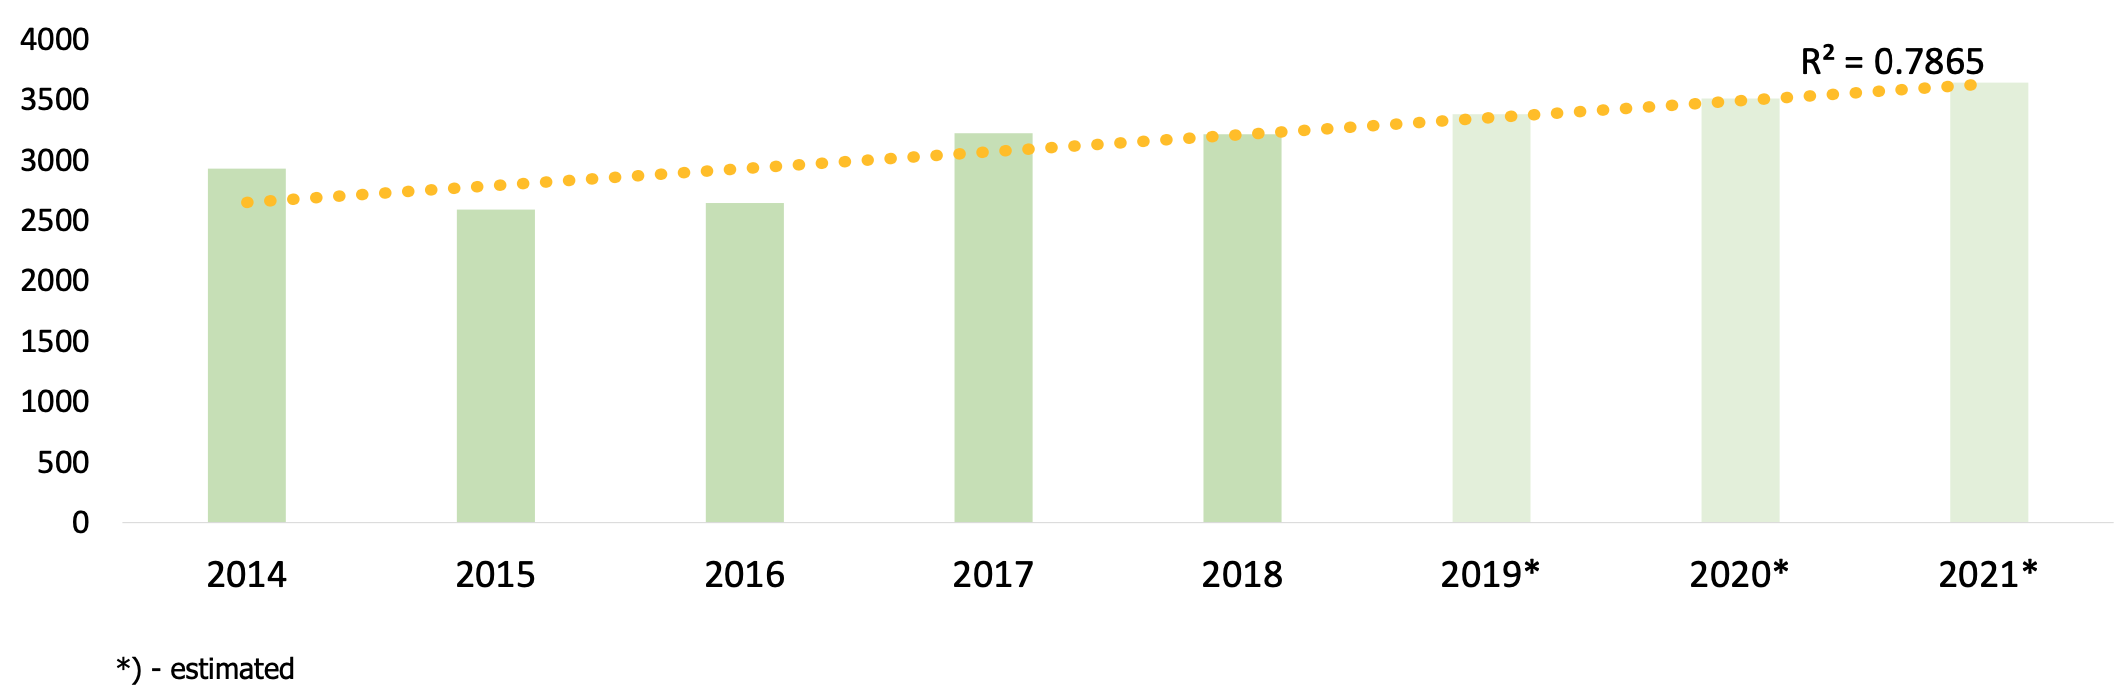
Within a 15-minute radius, there are 38,412 adults aged 18 years or older ( or 4,4% of the population) – that have chronic diseases. In 2014-2021, the number of estimated newly diagnosed chronic diseases incidence increased, presenting an upward trend for new disease cases. However, Site 1 is characterized by high proximity of other CVS stores within a 6.2-mile radius, accounting for 17 operating CVS stores. Based on this, the location has just 2260 chronic diseases incidence per single CVS store.
Site 1 is defined by:
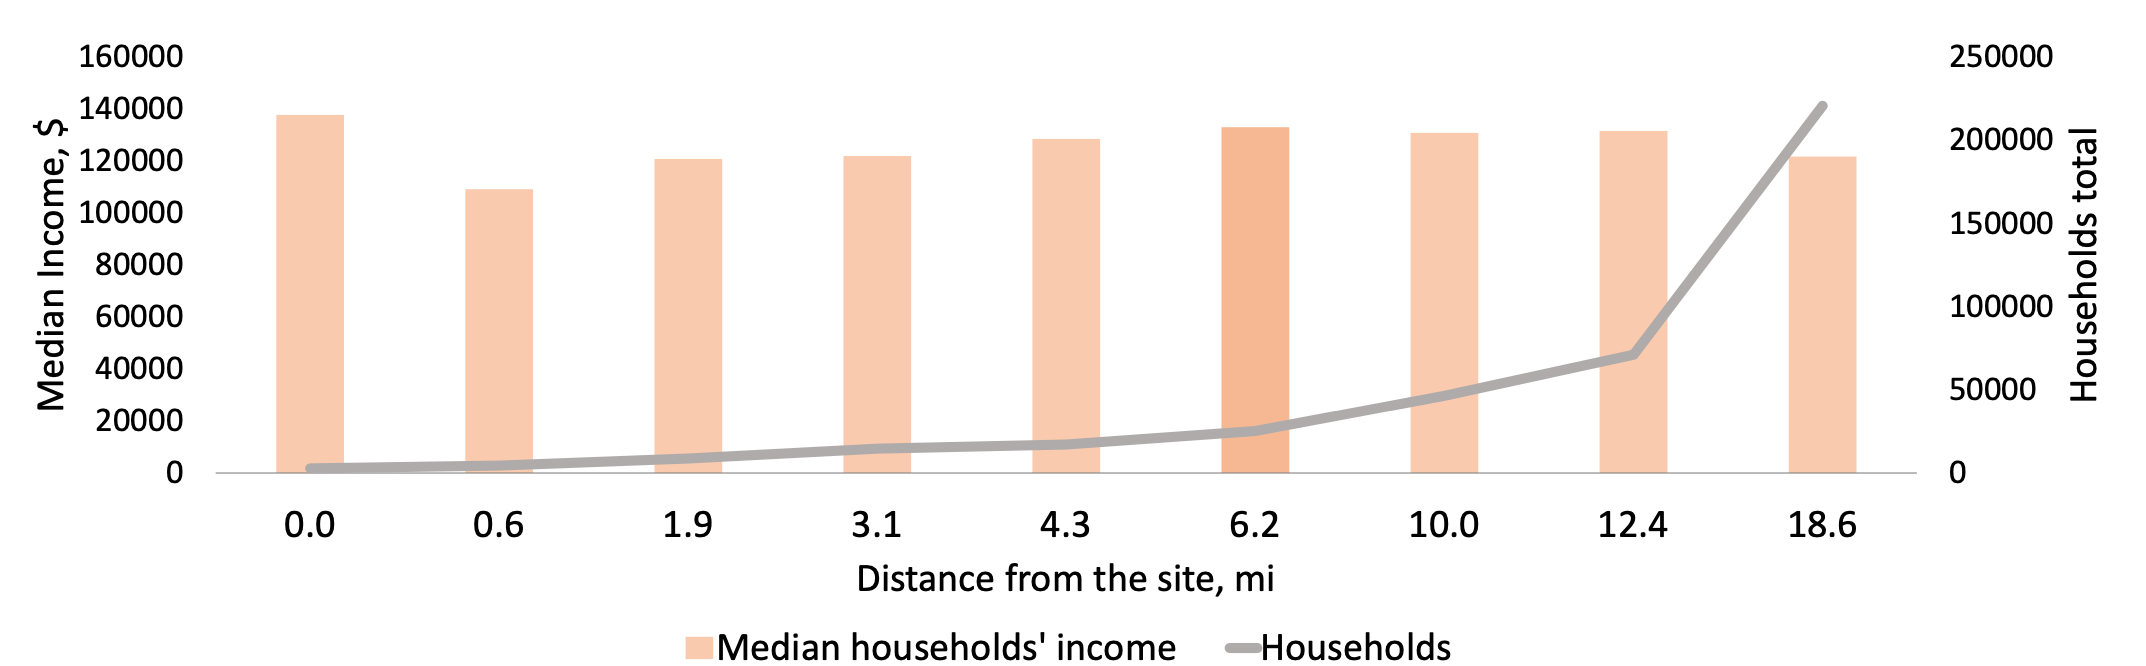
- Abundant population within the 6.2 mile radius – approximately 880,000
- Sufficient median households’ income – $51,223
- High proximity of other CVS stores – 17
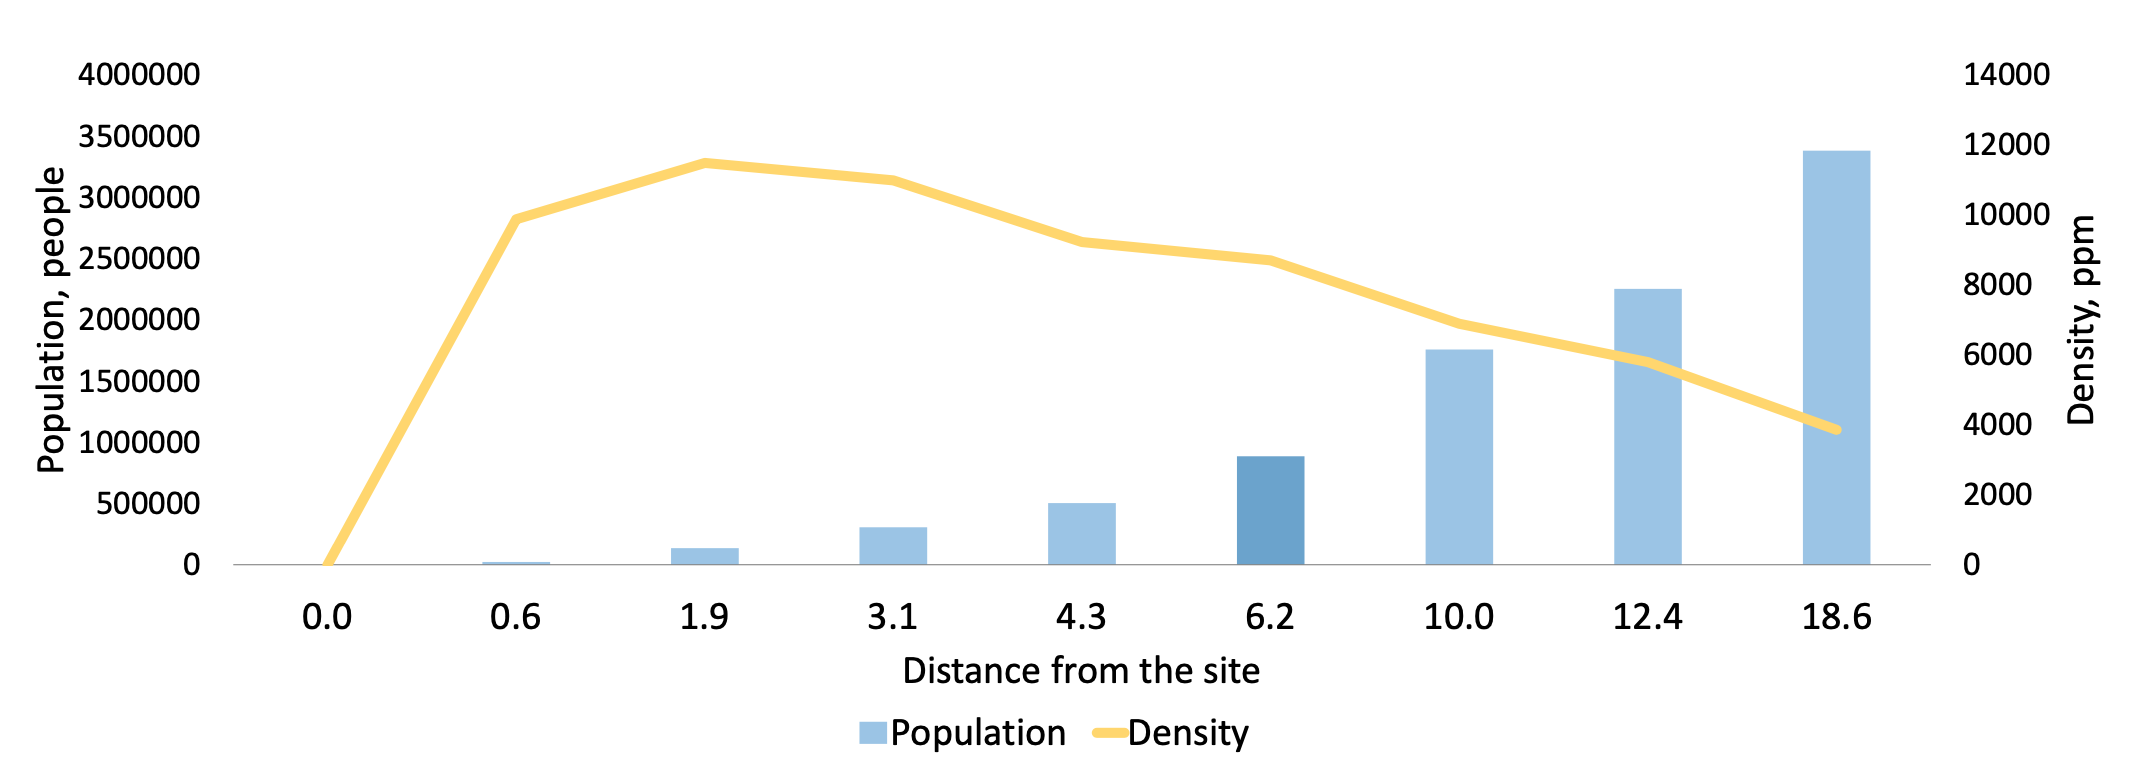
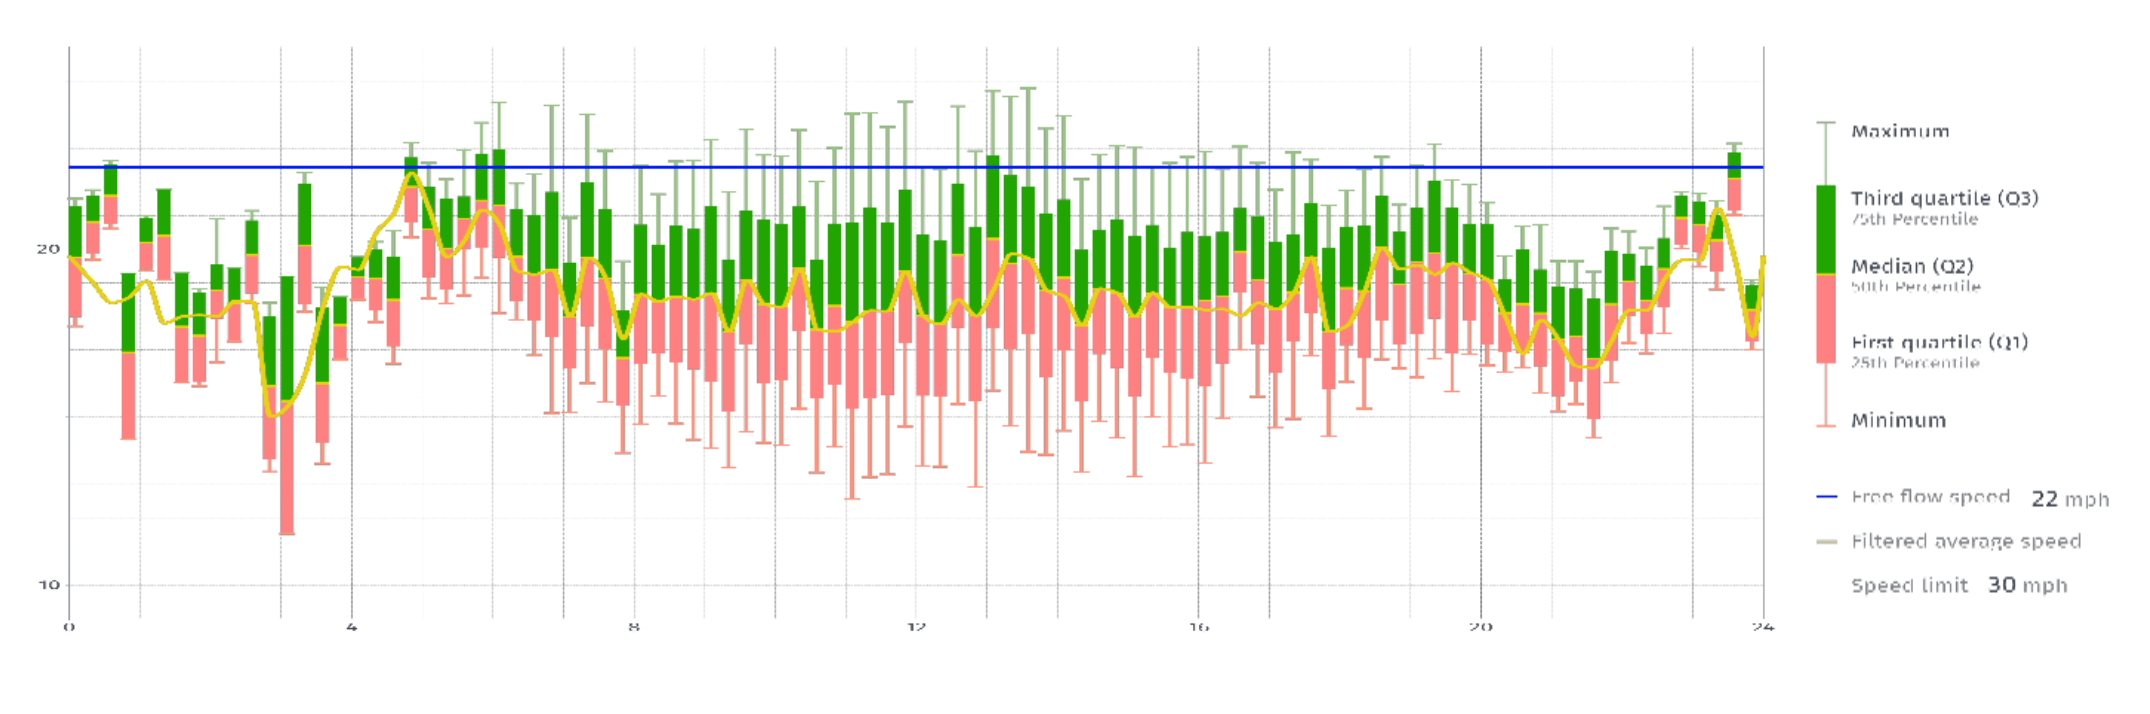
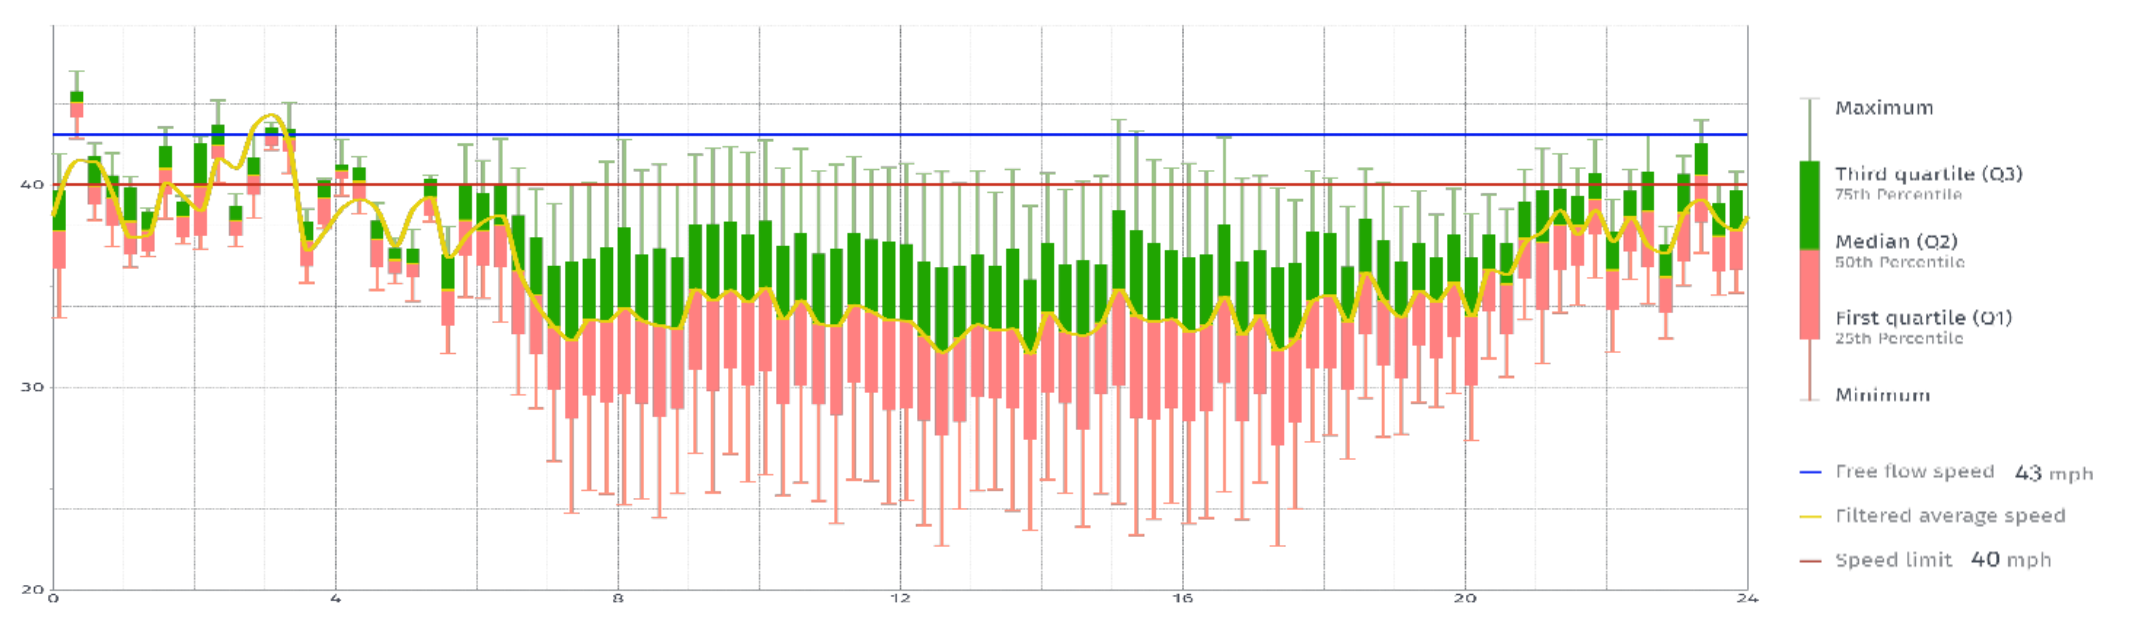
Site 1 is characterized by a low average daily traffic (ADT) flow – 16,305 vehicles. But it is important to note that wide distribution of vehicle speed for both primary and secondary roads suggests a high likelihood of vehicles stopping at the site for shopping, at least 10 am and 4 pm. Site 1 seems to be adjacent to destination points for large numbers of potential customers, as significant number of cars move at low speed. At the same time, sufficient number of cars moving at high speeds leads to a conclusion that slowdown in traffic flow reflects drivers travel intentions and is not caused by traffic congestion.
Observing location parameters, Site 1 is characterized by good visibility and sufficient parking space.
Nevertheless, considering high proximity of other CVS stores within a 6.2-mile radius, it’s reasonable to reduce the store density within the area of Site 1 to meet current goals of CVS business model. Aggregating multiple criteria for Site 1, including lower chronic diseases incidence per store, lower traffic volumes, shopping behavior only during limited daytime hours, and lower household income, we might be willing to find more suitable candidates for transformation into a “HealthHub” store.
Site 4 – business model of a traditional store
Aggregating parameter’s values for Site 4, it is better to keep the existing business model of a traditional CVS store. Firstly, estimated chronic diseases incidence within a 6.2-mile radius from Site 4 is 2161. Considering low number of drugstores in the area, there are only 1081 chronic diseases incidence per one CVS store.
Secondly, in a 15-minute drive from the site (6.2-mile radius) there are upper-middle income population with median household income of $132,866.
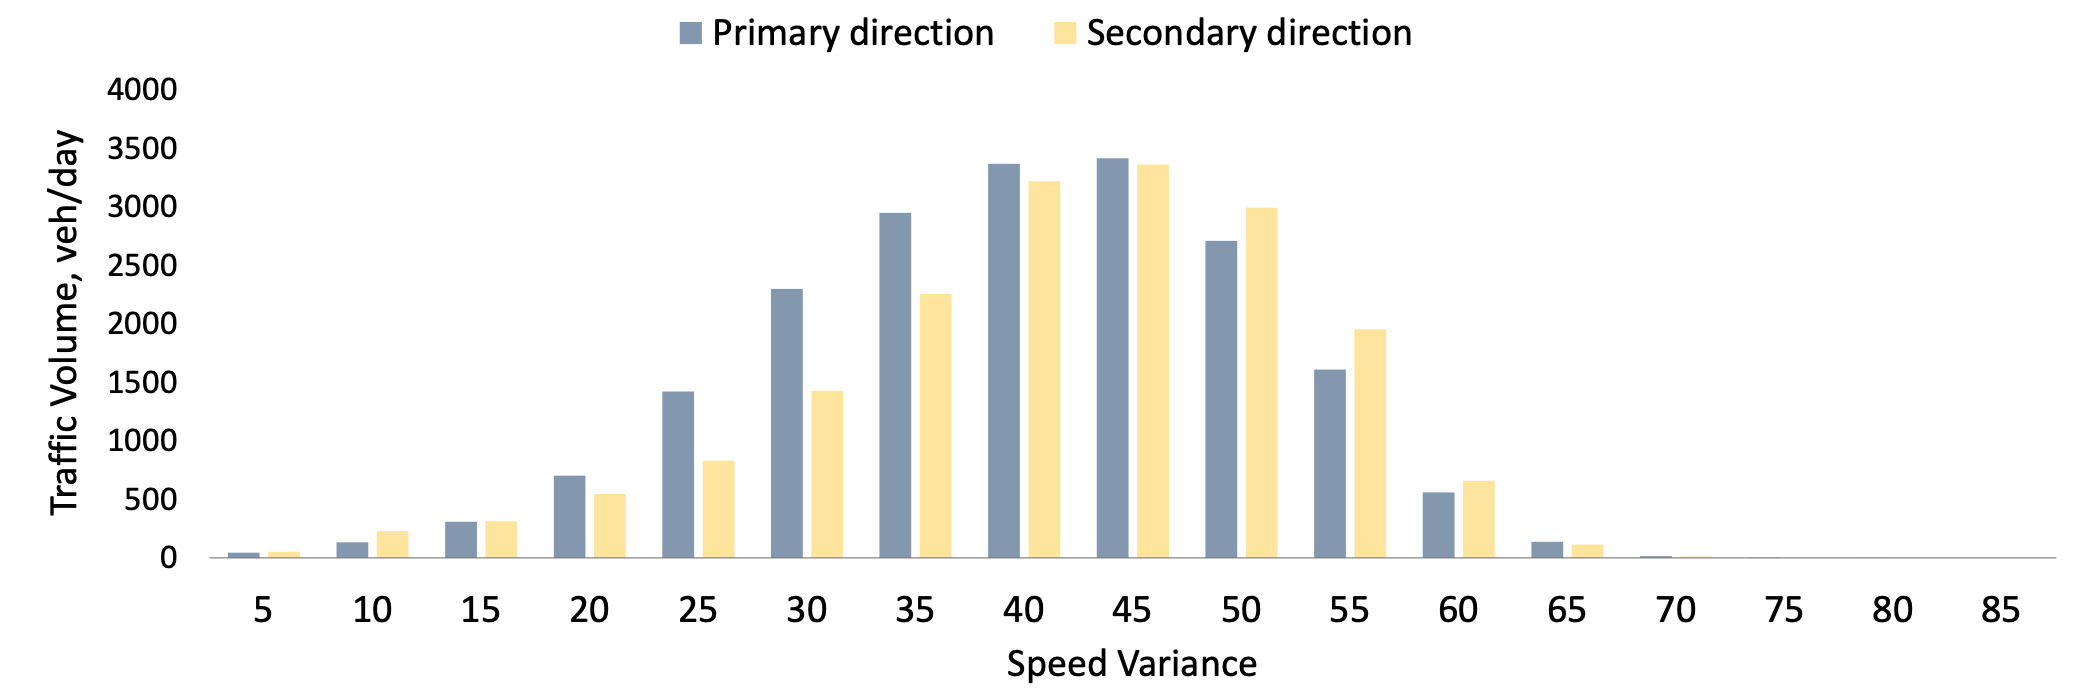
Traffic patterns evaluation of Site 4 indicates high average daily traffic (ADT) volumes accounting for nearly 30,000 vehicles. Substantial traffic flow near the site increases the probability of customer visits.
Local traffic flow fluctuations at Site 4 indicate considerable speed variance in the primary direction. That suggests that the business site is adjacent to destination points for a large numbers of potential customers. Site 4 is defined by sufficient number of cars moving at both high and low speeds. Percentage of low-speed travelers in the secondary direction is smaller, presenting fewer chances of drivers stopping at the location. Still, shopping behavior prevails in both directions, especially in primary one.
Thus, assuming multiple characteristics including a decreasing trend of chronic diseased incidence, high median household income, low proximity of other CVS stores, and shopping behavior of drivers, Site 4 presents an example of a site with high potential to grow as a C-Store. It would be acceptable to keep the existing business model of a traditional CVS store at the Site 4.
Site 6 – Business model of a “HealthHub” store
15,085 of adults aged 18 years or older, or 6,1% of the population within a 15-minute drive from the Site 6, have chronic diseases.
Compared with other CVS stores, site 6 is characterized by:
- Sufficient population in the area – nearly 247,000
- Significant median households’ income – $62,290
- Results of our research show that some areas experience regular traffic patterns without any substantial changes in traffic demand, which makes it important to explore traffic patterns in specific areas apart from general assumptions.
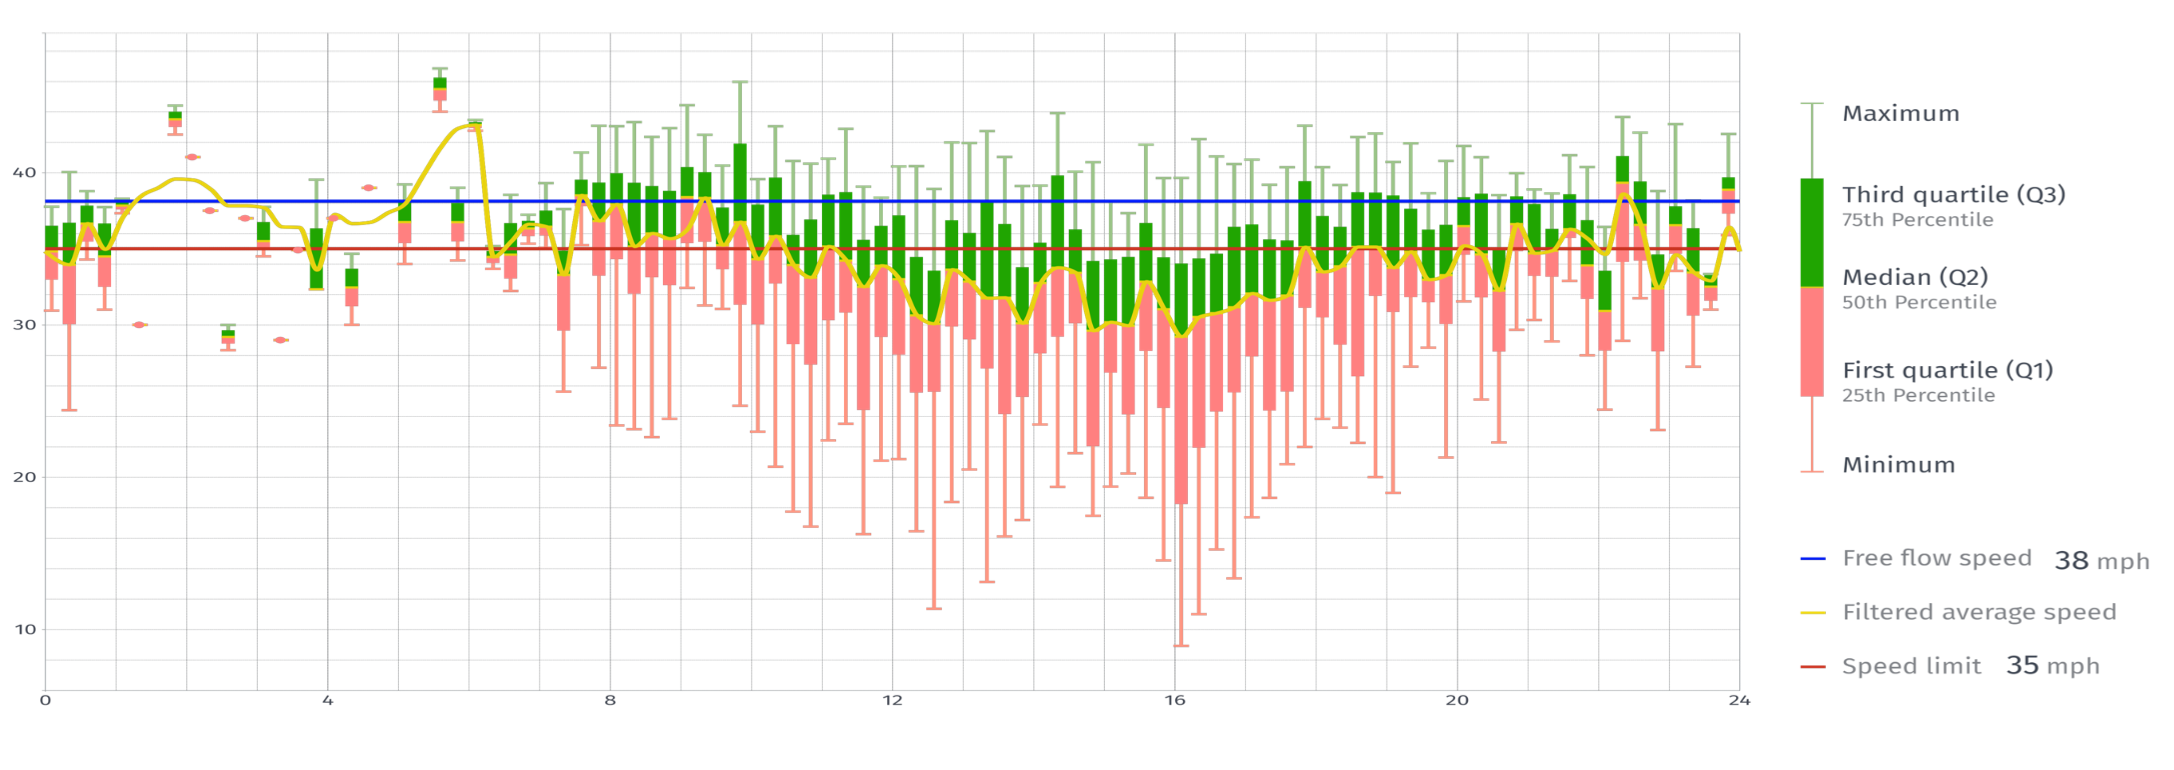
Site 6 is located near the highway with high average daily traffic (ADT) volumes – 43,616 vehicles. Assessing the hourly speed variance of the vehicles passing by the site in primary direction, we suggest rather strong shopping behavior. Also, high ADT, good visibility, ease of access with a traffic signal, and sufficient parking space increase the chances for a store to attract drivers to stop for shopping or service.
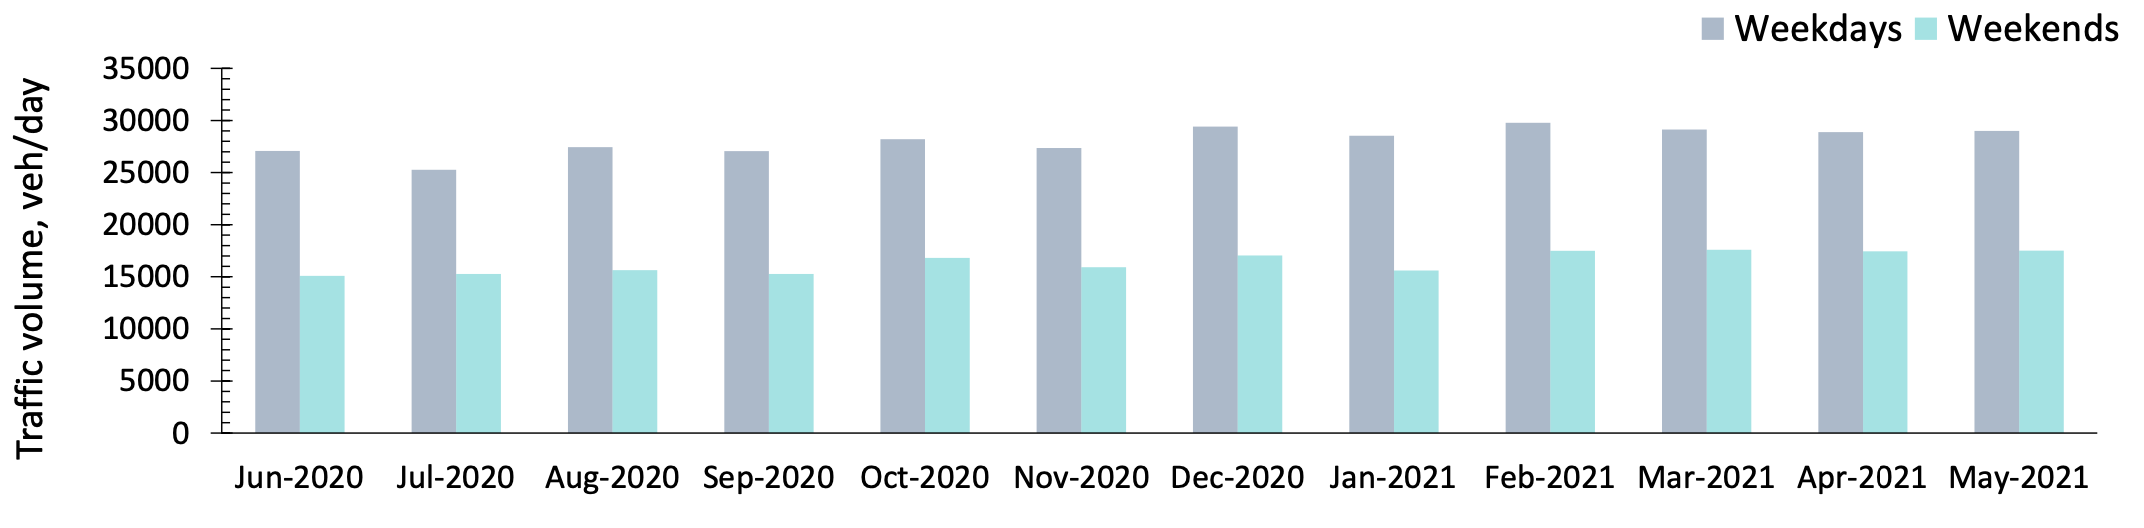
Analyzing traffic patterns of Site 6, we might see that seasonal traffic changes are quite low, presenting no significant fluctuations. For many scenarios, and certainly depending on the area of interest, seasonal fluctuations and variations should be observed. Knowledge of monthly ADTs is extremely valuable for optimization of business operations, including revenue and sales, supply chain, inventory stock and personnel management.
Leveraging multiple criteria for the assessment of Site 6, we have come to the conclusion that a traditional CVS store located there might be transformed into a “HealthHub” store to meet the local needs of the population with chronic diseases.
Site 11 – Store Closure
There is only 709 chronic diseases incidence per one CVS store here, which is low for the region. The number of newly diagnosed incidence is rather low (144 cases) compared to other sites.The main characteristics of the Site 11 are:
- Small population within a 6.2-mile radius – nearly 23,000
- Sufficient median household income - $62,291
- Relatively low number of other CVS stores in proximity – 3
Traffic patterns at Site 11 are defined by rather low average daily traffic (ADT) volumes accounting for 13,268 vehicles. Analyzing the traffic patterns for Site 11 for both primary and secondary directions, we suggest an absence of strong shopping behavior.
Leveraging multiple criteria for the analysis of Site 11, including low number of chronic diseases incidence per one CVS store, small population value, and insignificant volume of traffic flow, we suggest that the site doesn’t present any sufficient reasons to be transformed into a “HealthHub” store or to continue operating within the existing business model of a traditional store. Based on the abovementioned parameter values, our analysis suggests that the site could be shut down.
Therefore, evaluating 12 CVS stores we’ve chosen which site suites the best for transformation into a “HealthHub” store, which one is better to develop within the existing business model, and which site presents no benefits for further operation.
Conclusion
Aggregation of multiple characteristics of CVS stores, including consumer-based characteristics and traffic patterns, allows the user to evaluate the existing sites and optimize their growth by proper site selection and further transformation into modern “HealthHub” stores. In the process of traffic pattern analysis of the sites, the distribution of traffic volume metrics is usually more or less stable for each site of interest, but fluctuates broadly between different areas due to location-specific impacts. Daily and monthly ADTs leveraging provide the company with additional opportunities for optimization of business operations, including revenue and sales, supply chain, inventory stock, and personnel management. Reports provided by Ticon include broad and comprehensive traffic flow data and information, including by-day and by-month ATV distribution, speed/volume charts, etc.
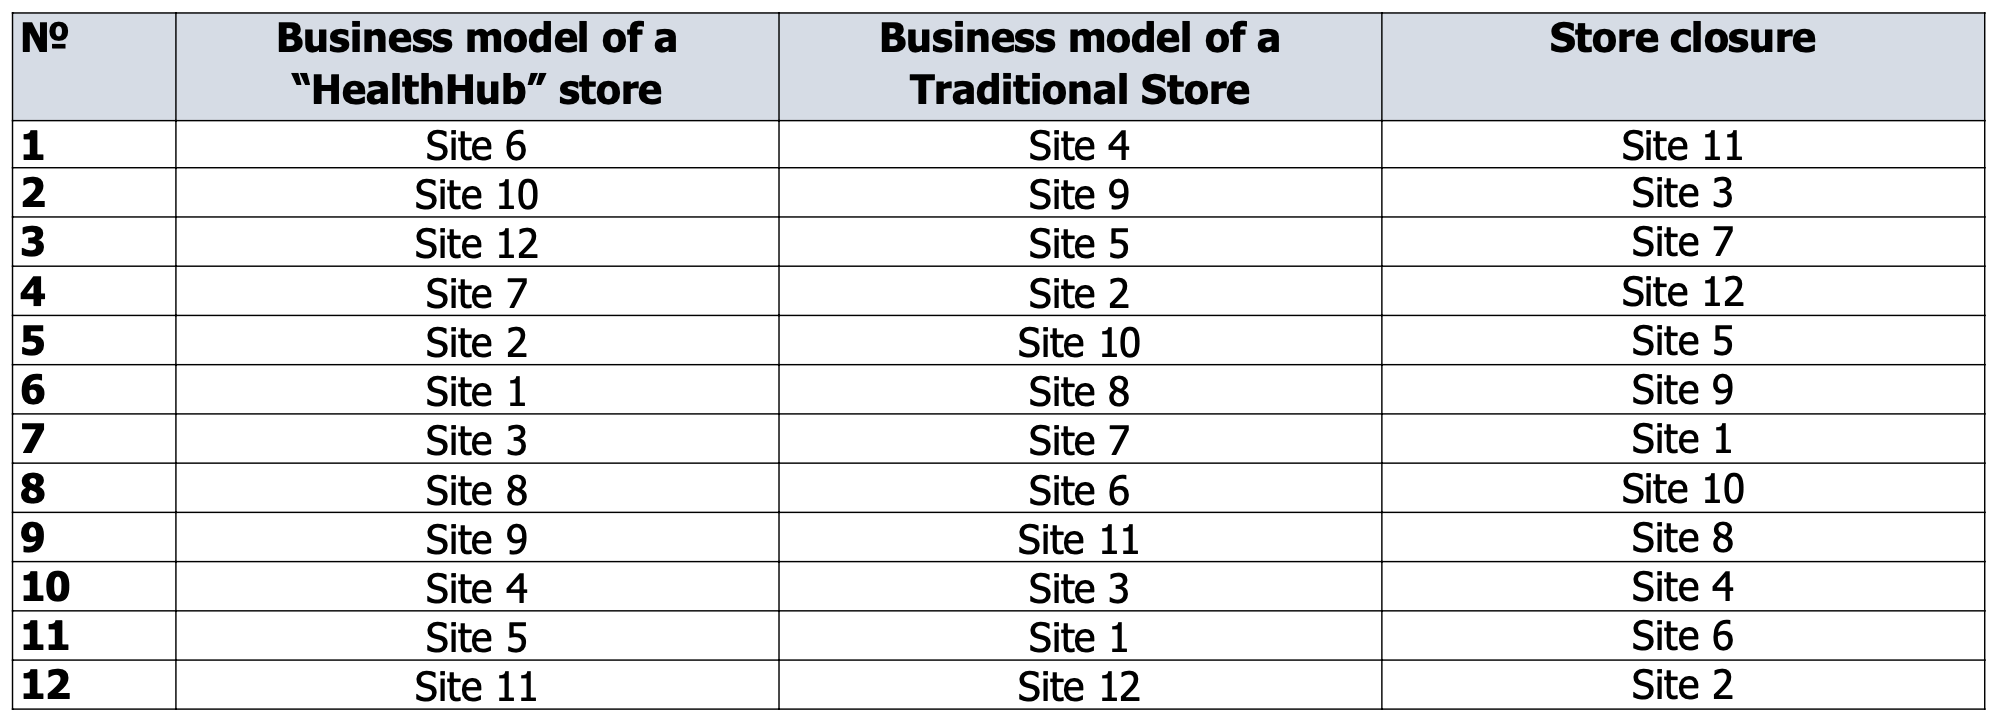
Also, it is possible to get a comprehensive network-based decision on drugstore operation. Table 2 presents a clear visualization of a store rank in Pennsylvania based on three business models considered in this Study, where “1” indicates the store which is the most appropriate for the following model and “12” – the least appropriate. We used multiple criteria for the site assessment of two distinct business models and an option of store closure, to indicate which stores have the best fit for one of the presented models.
The case study is limited in many aspects, as it doesn’t take into account many crucial business factors, such as personnel characteristics, the history of the enterprise, regular customer base, the sales mix, current profitability, and many others, which are much better known to the customer. Thus, we don’t claim that we intend to find an “ideal spot” for your company.
However, being experts in transportation engineering, traffic analytics, traffic data collection, and Big Data science, we will provide you with reliable information on traffic volumes, driver behavior, and demographics, including income and health conditions, that will complement your in-depth knowledge of drugstore industry. By aggregating and organizing all relevant data on the site characteristics, our reports would support you in making more accurate and informed executive decisions.