How Traffic Data Helps Winning Frequent Customers


Many of our clients know that access to comprehensive and reliable traffic data facilitates not just the site selection, but operation planning processes as well.
For example, the ability to observe year-round traffic fluctuations and regularities helps to understand sales performance and anticipate customers' needs, and in the end, gain more customers and increase ROI.
With Ticon’s traffic and demographic data-driven insights, you can fine-tune your operation controls to manage the performance of each c-store, without the need to reveal your proprietary information to any outside contractors.
In fact, c-store operators often miss their sales opportunities due to the lack of insight about high-demand hours and periods when the traffic near the store is the most intense and the conversion rate is high. A common problem of having unhappy customers complaining about long wait times in line to pay for their purchase can be dealt with proactively when critical information on anticipated demand is at your disposal. Due to the periodic nature of traffic fluctuations, customers demand can and should be forecasted.
In this blog, we are going to focus only on the application of traffic data for operations planning and optimization. Later on we are going to discuss how our data helps convenience stores to select the next perfect location.
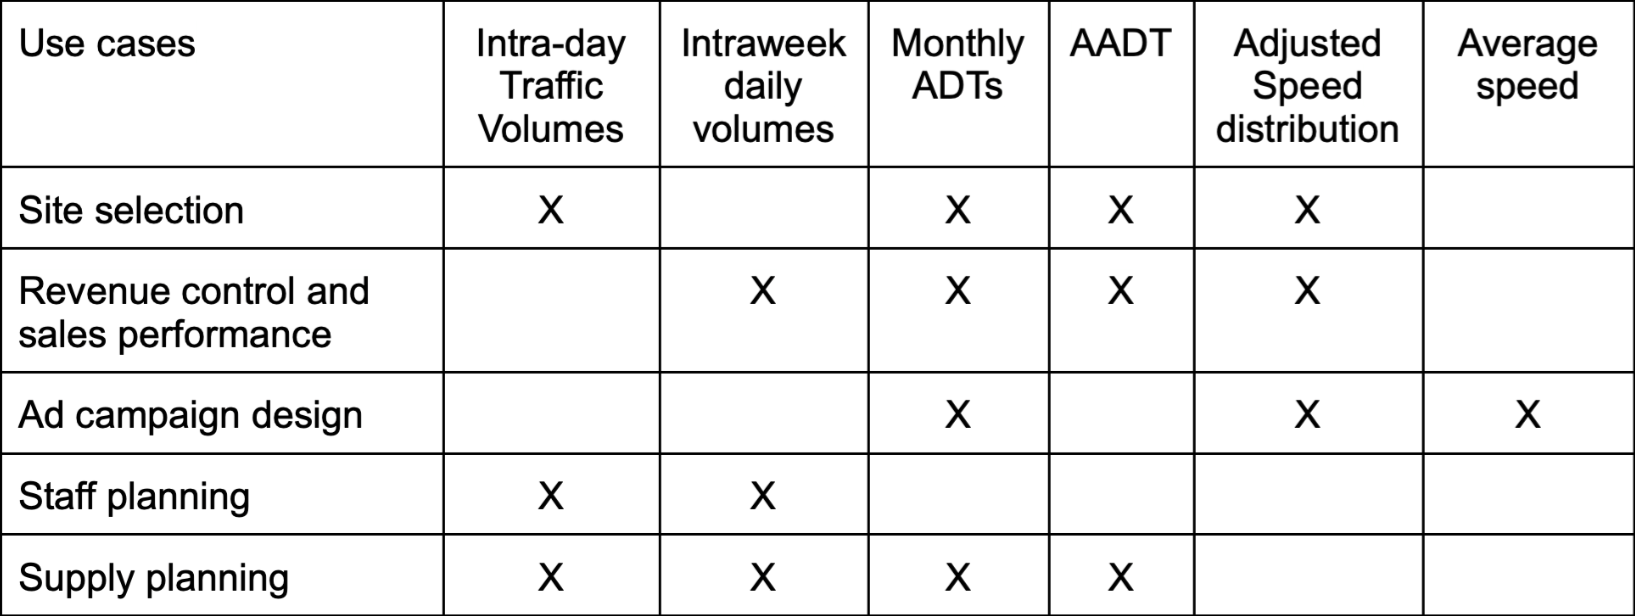
Let’s now see how knowledge of intraday, intraweek, and seasonal changes in traffic flow helps in the optimization of c-store operations (Table 1).
There are various approaches to understanding traffic parameters due to nonidentical traffic behavior and daily, weekly, and seasonal traffic flow dynamics:
- Intraday is used for the management of customer queue times and personnel workload
- Intraweek - for the management of supply chain efficiency and personnel workload based on load fluctuations per days of week
- Seasonal - for progressive planning by identifying the trend in demand variations.
The Figure 1a below shows a change in intraday traffic as commonly seen in approximately 30% of c-store locations. A significant increase in traffic occurring between 7 and 8 am and being several times higher than at any other time, shows the perfect opportunity for C-stores to win frequent customers during breakfast time. According to a recent finding, the most loyal customers visit quick-serve facilities during early morning hours. But to attract repeat customers in the morning, it’s vital to provide proactive customer support meaning anticipate and fix issues before they occur. During breakfast hours, when people are especially in a hurry, they expect plenty of registers to be open, to serve them promptly. Otherwise, customers will likely have less desire to visit your store again.
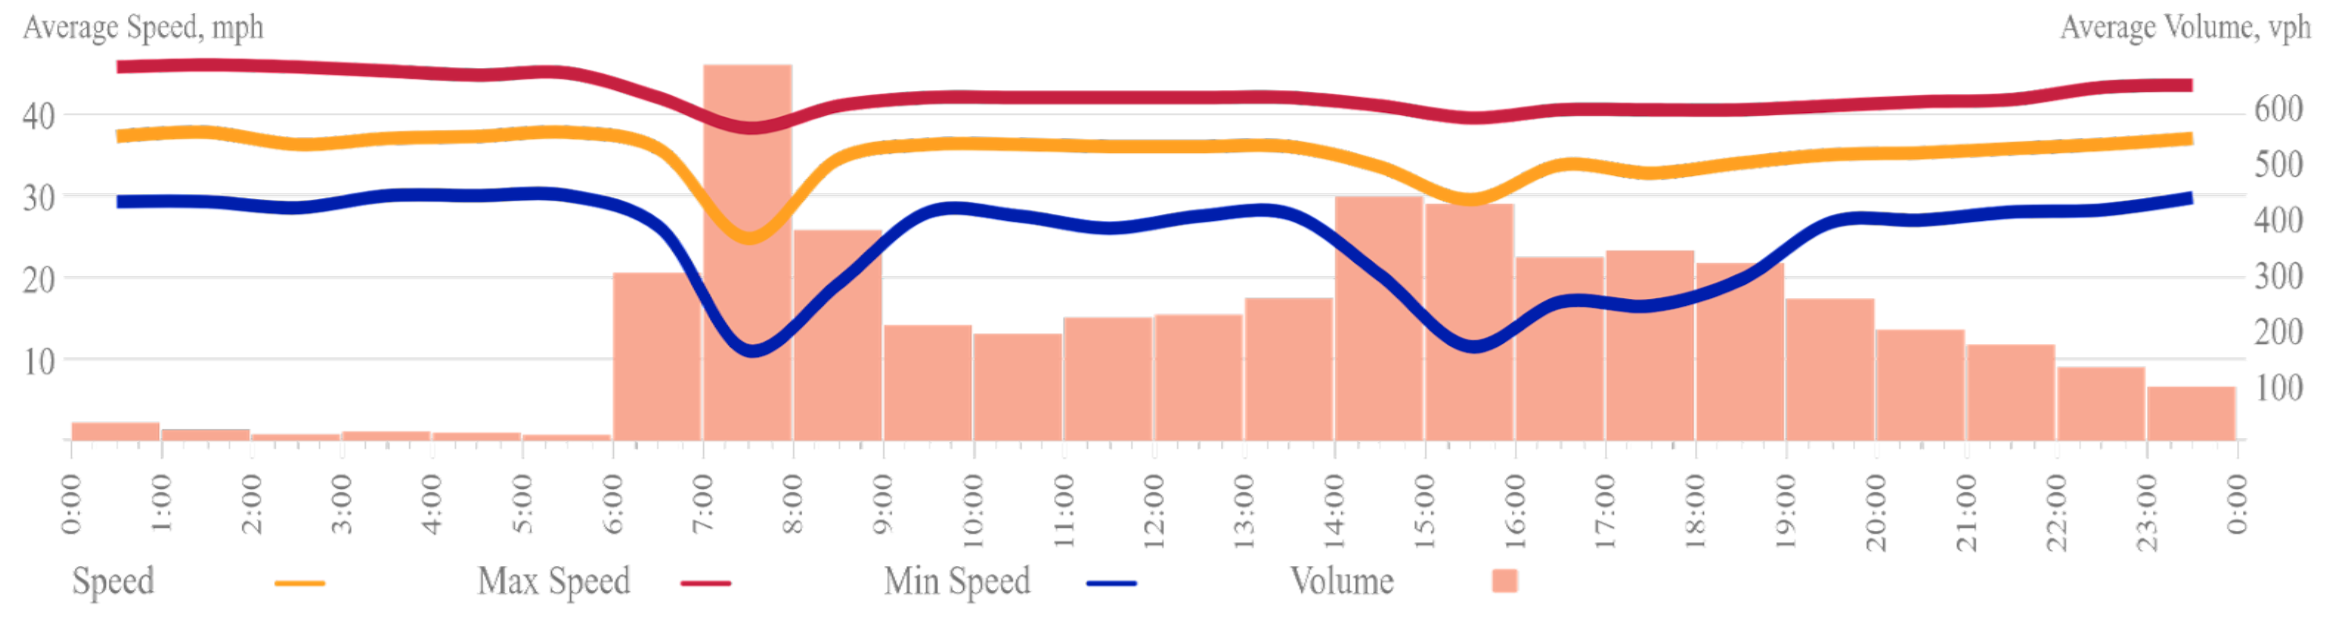
The types of service should also be planned with reference to information about the intraday traffic patterns, due to a known phenomenon of different needs of PM and AM customers.
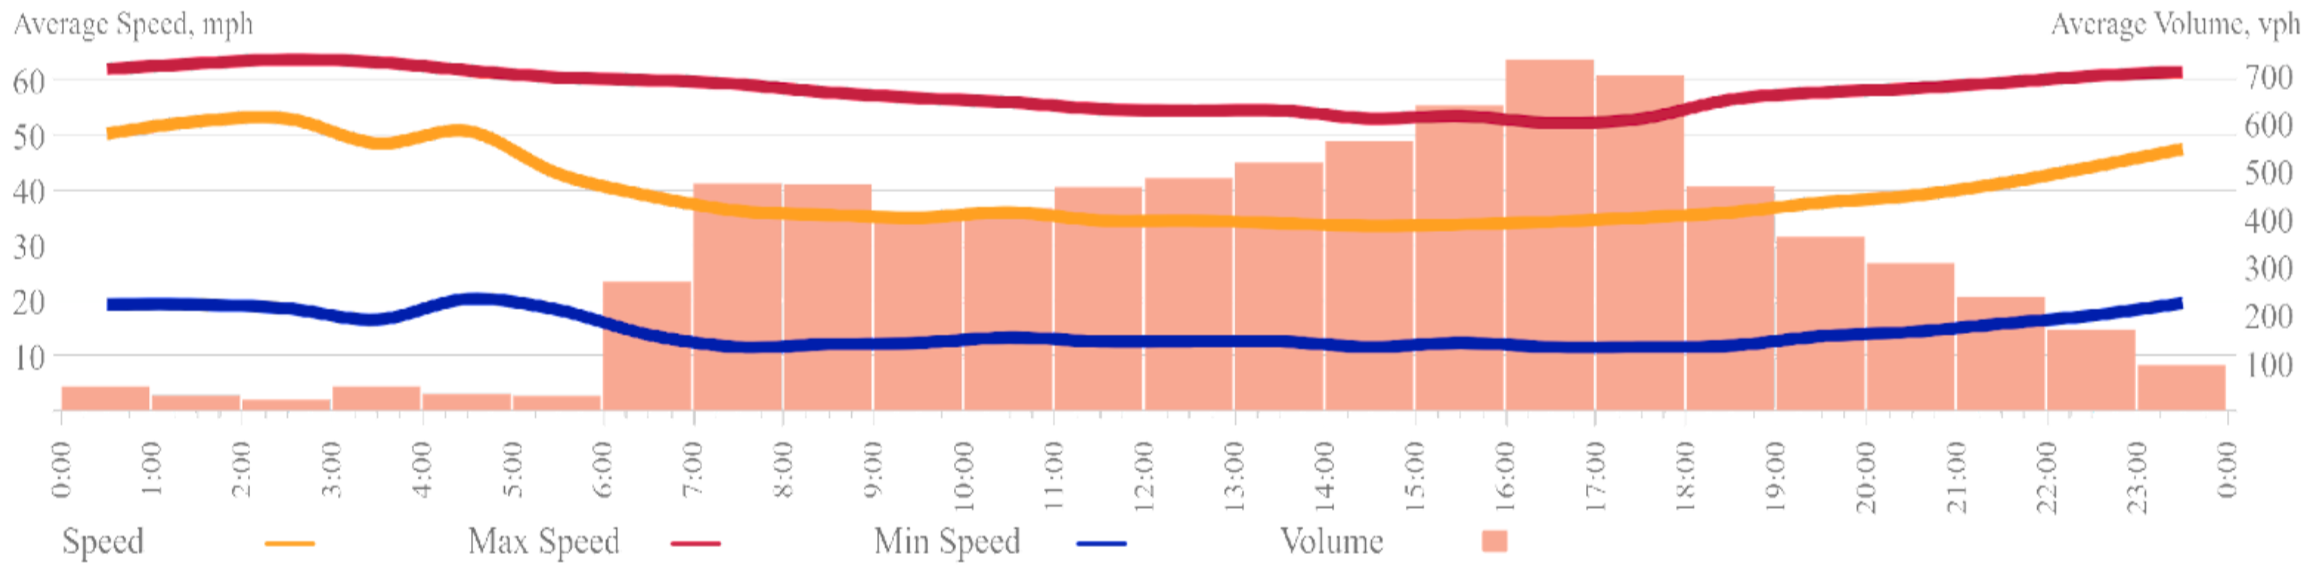
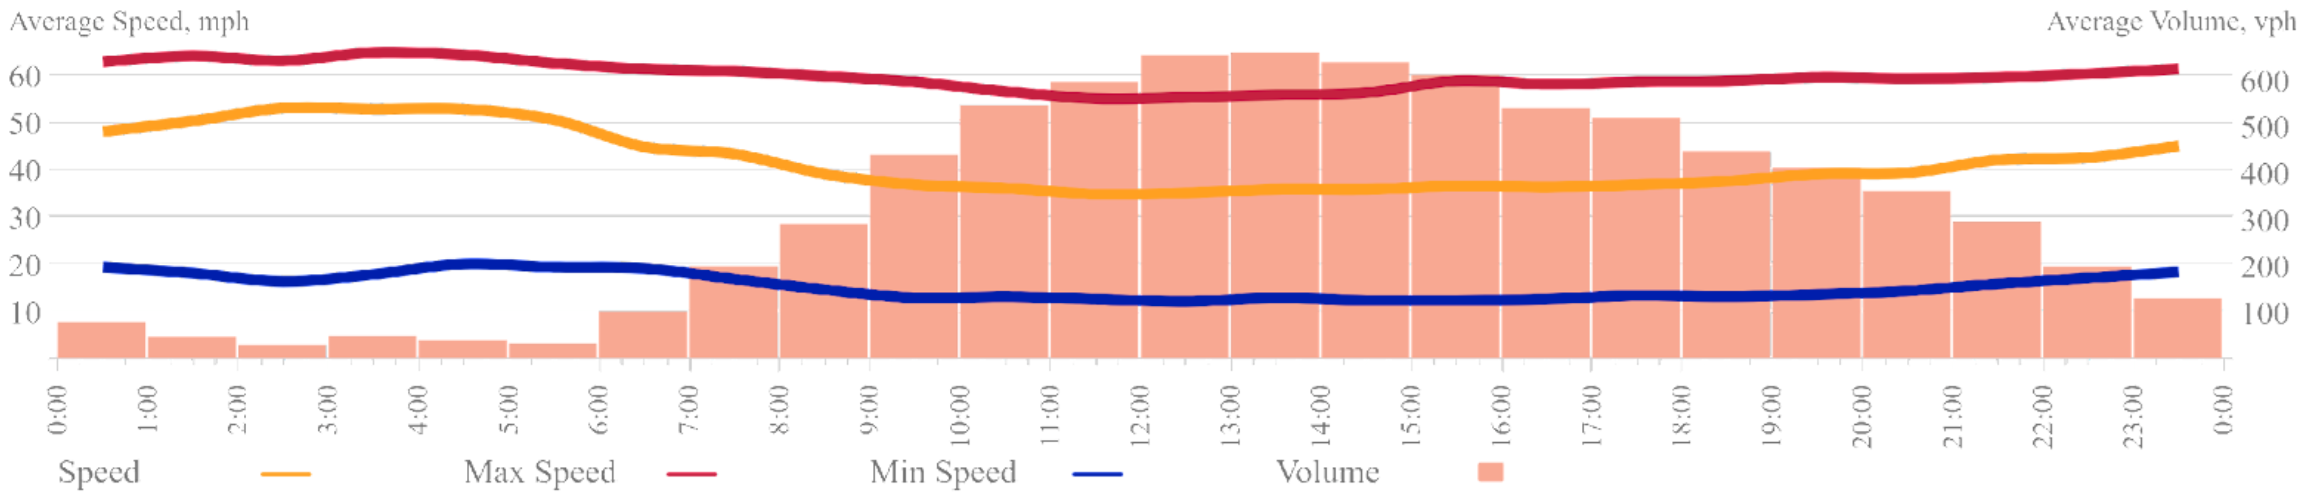
Also, even though it is expected that the majority of the customers shall come from the primary direction, the conversion rate from a secondary one also has a non-zero value, especially for the streets with direction-changing middle lanes as shown in the illustration above. Thus, it makes sense to analyze both directions which usually have different traffic flows. As it is impossible to predict intraday traffic patterns, just like any other types, as they vary substantially between the locations, and for the same location - from weekdays to weekends (Figure 1c), sometimes even between seasons - they have to be reordered for each site regularly, once every 2-3 years.
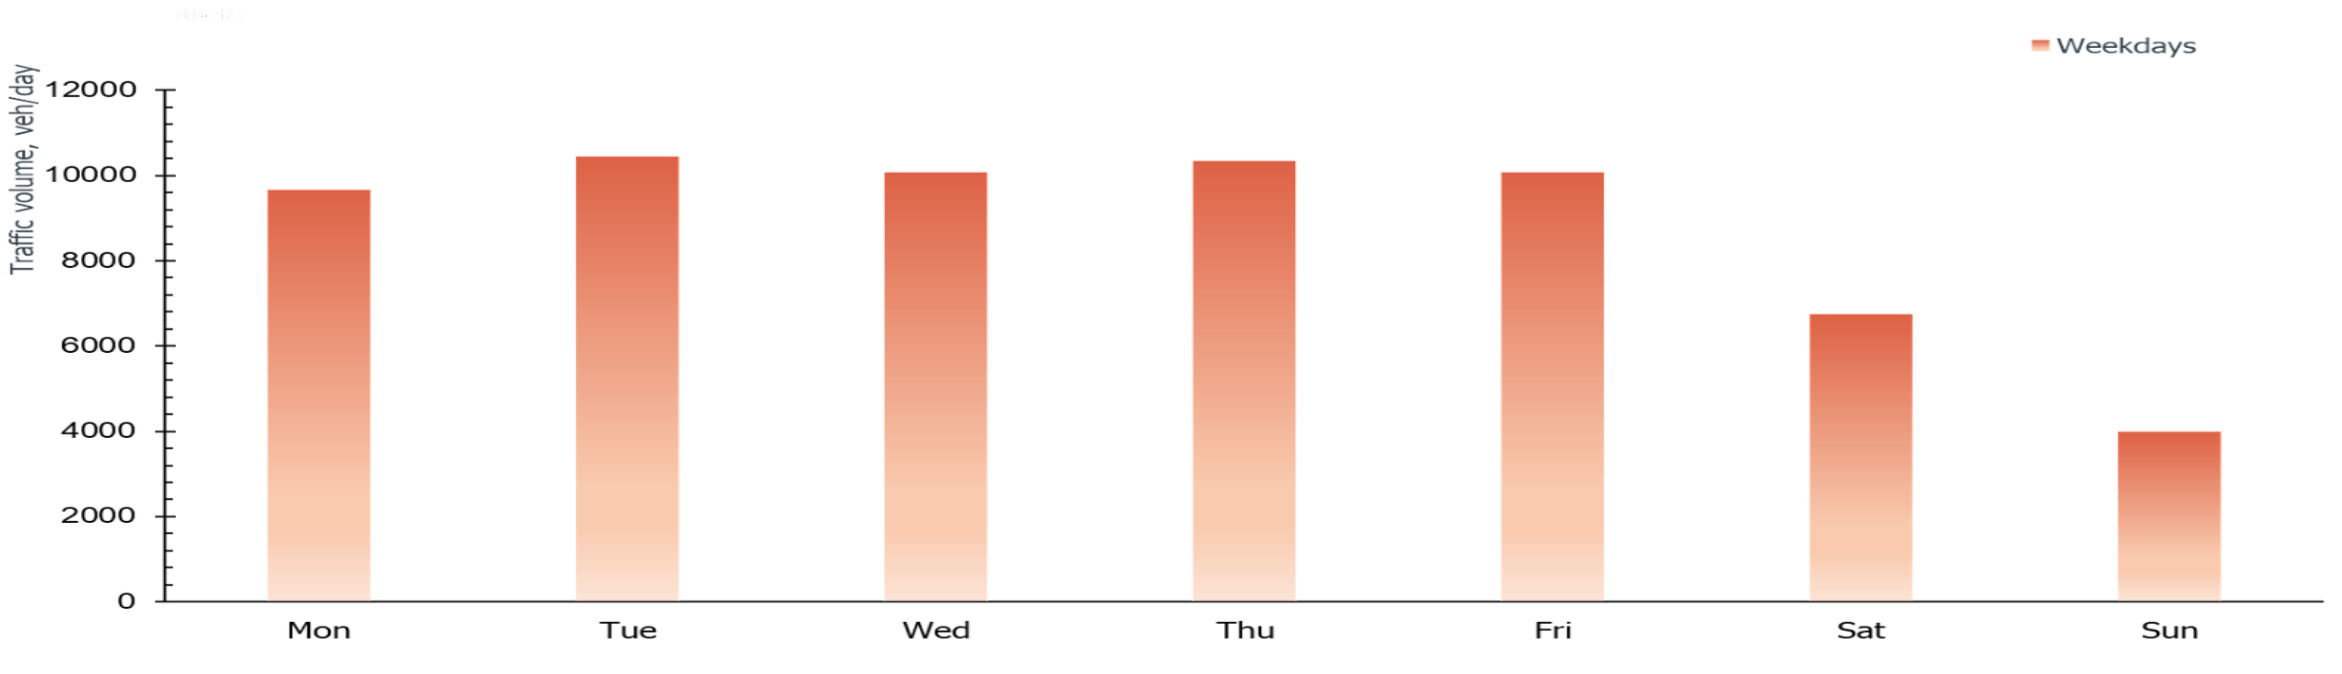
Intraweek traffic flow fluctuations are well known. Figure 2 shows the average change and expected variation of traffic intra-week, which is typical for about 70% of c-store locations. But sometimes there are cases when weekend volumes are substantially higher than weekday ones. If you don’t know about this, it may be easy to lose revenue.
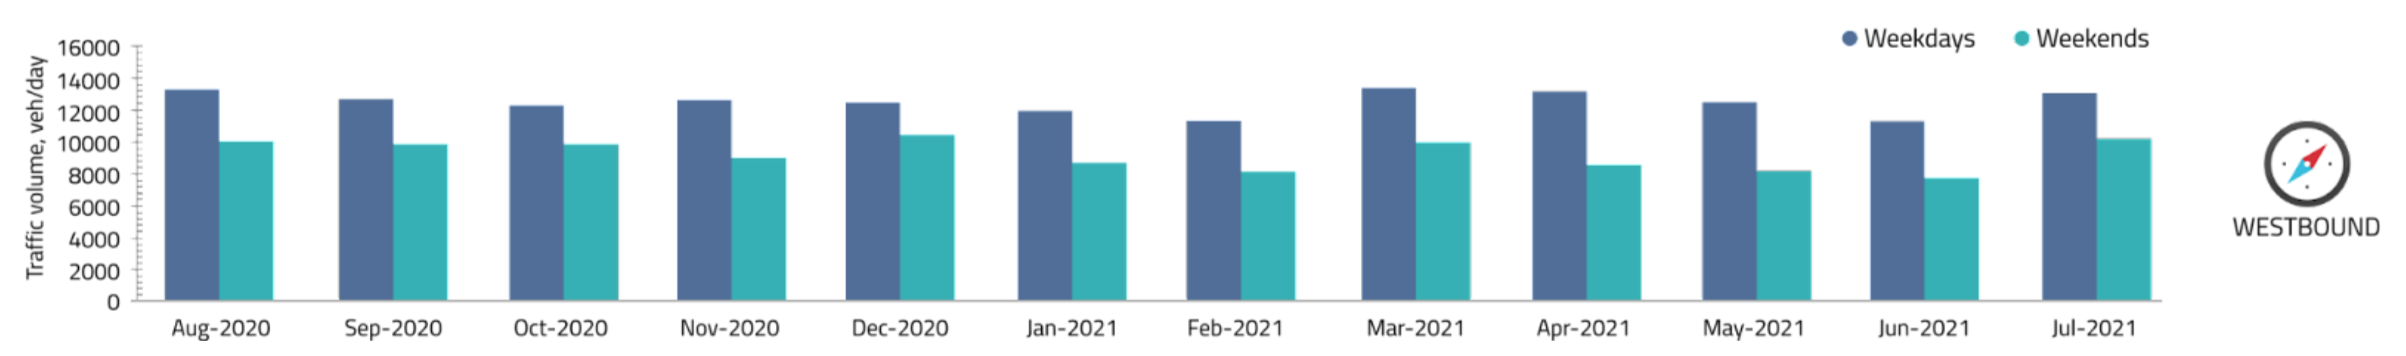
Intraweek traffic flow fluctuations may differ significantly even on closely colocated roads. Despite common misconception, intraweek fluctuations are often seasonal, and for this reason, in our reports, are provided with monthly values (Fig. 3a). Making predictions about customer demand based on the reliable nuances of drivers' behavior allows the operator efficiently manage employees' workload, improve supply chain planning, and, as result, maximize sales.
Once more coming to the issue of attracting frequent customers, we see how likely it is for a company to achieve this goal as most of the traffic is generated on weekdays when people are on the way to work (Figure 2).
It is important to note that in some places, or during some seasons, this ‘common’ change is not relevant - and it is better to know which case is yours you might not know which case is yours. And, of course, such knowledge comes only from traffic analytics.
Seasonal fluctuations of traffic volumes can also be very significant. They should be carefully considered to avoid both shortage of staff and overstaffing, but also for the optimization of the supply chain.
Fig. 3a represents monthly changes of traffic volumes, typical for approximately 50% of c-store locations. As before, most of the traffic is generated during weekdays, even though monthly variations mostly adhere to the common pattern.
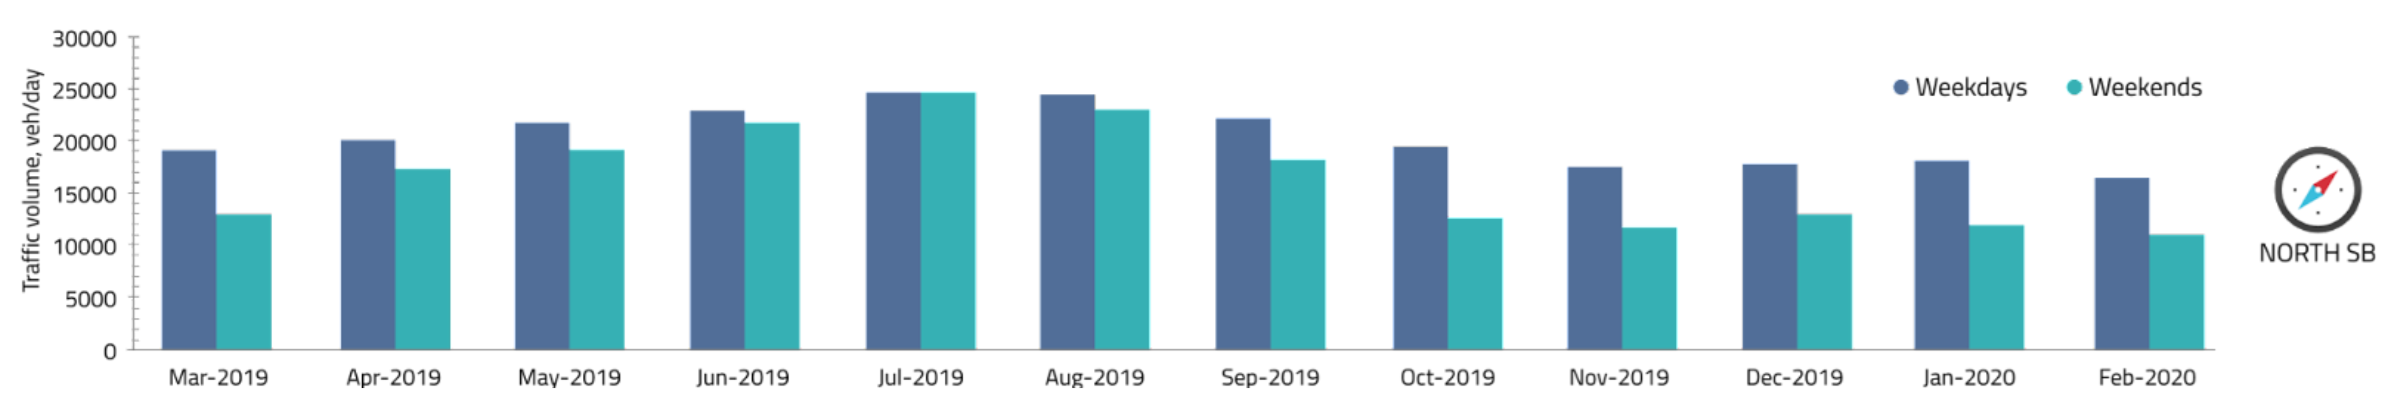
However, for some areas, the seasonal traffic changes can fluctuate unpredictably, despite the fact that they are usually more or less stable for each site of interest (Figures 3b and 3c).
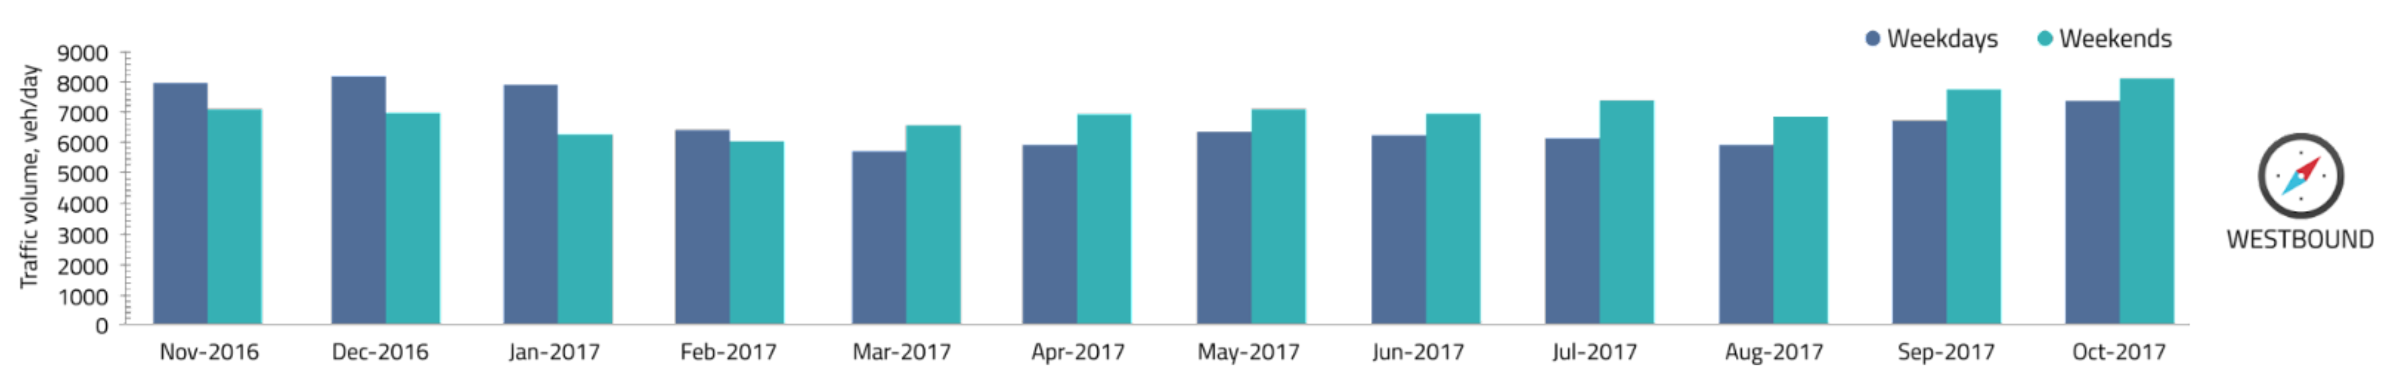
For many shopping areas you’ll often see weekend volumes “always be closing” to weekdays, or even exceed. Needless to say, the largest fluctuations one can observe at holiday destinations.
Seasonal fluctuations are also hard to predict. Sometimes even crossing streets can have extremely different seasonal traffic patterns. At the same time, for each site, these patterns are stable over the years, since they are associated with location zoning rather than with daily and weekly traffic demand changes.
Thus, adequate data for operational planning come only from year-round observation of traffic flows. Despite the opportunities unlocked by the development of new Big Data and connected car technologies, many c-store operators still rely on short-term measurements based on traditional countings, manual counts, or a one-week portable detection.
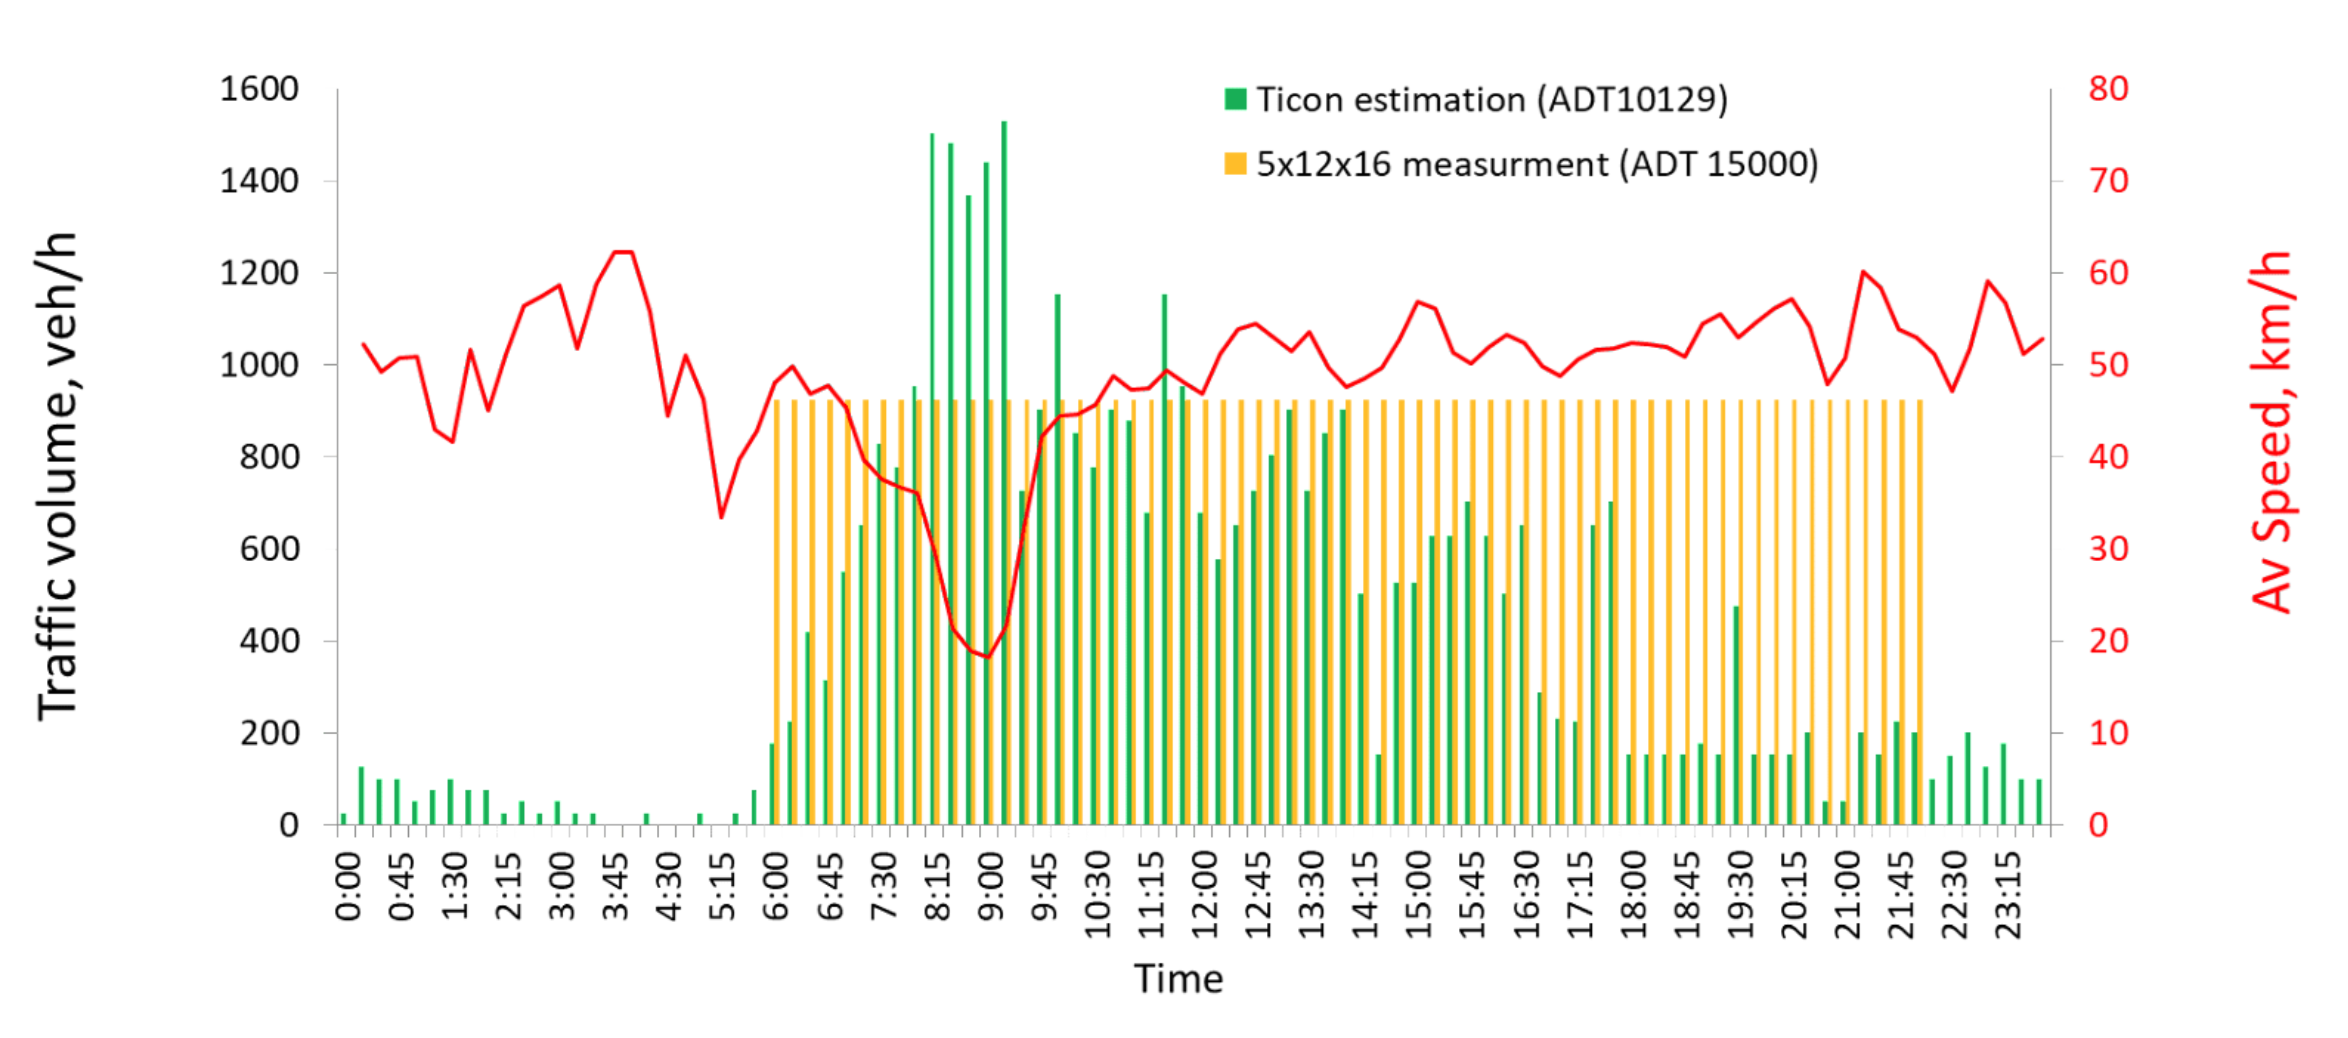
We even know the attempts to use drones or planes to obtain traffic data from air observation, which are extremely short-term and therefore may bring unpredictable errors to your plans. Figure 4 shows why data collection based on a short-term observation leads to a 35-40% or even more error in evaluated results. From the chart, one can see the significant difference between the traffic volumes estimated based on short-term measurements (5x12x16 measurement) and real traffic volumes (Ticon estimation).
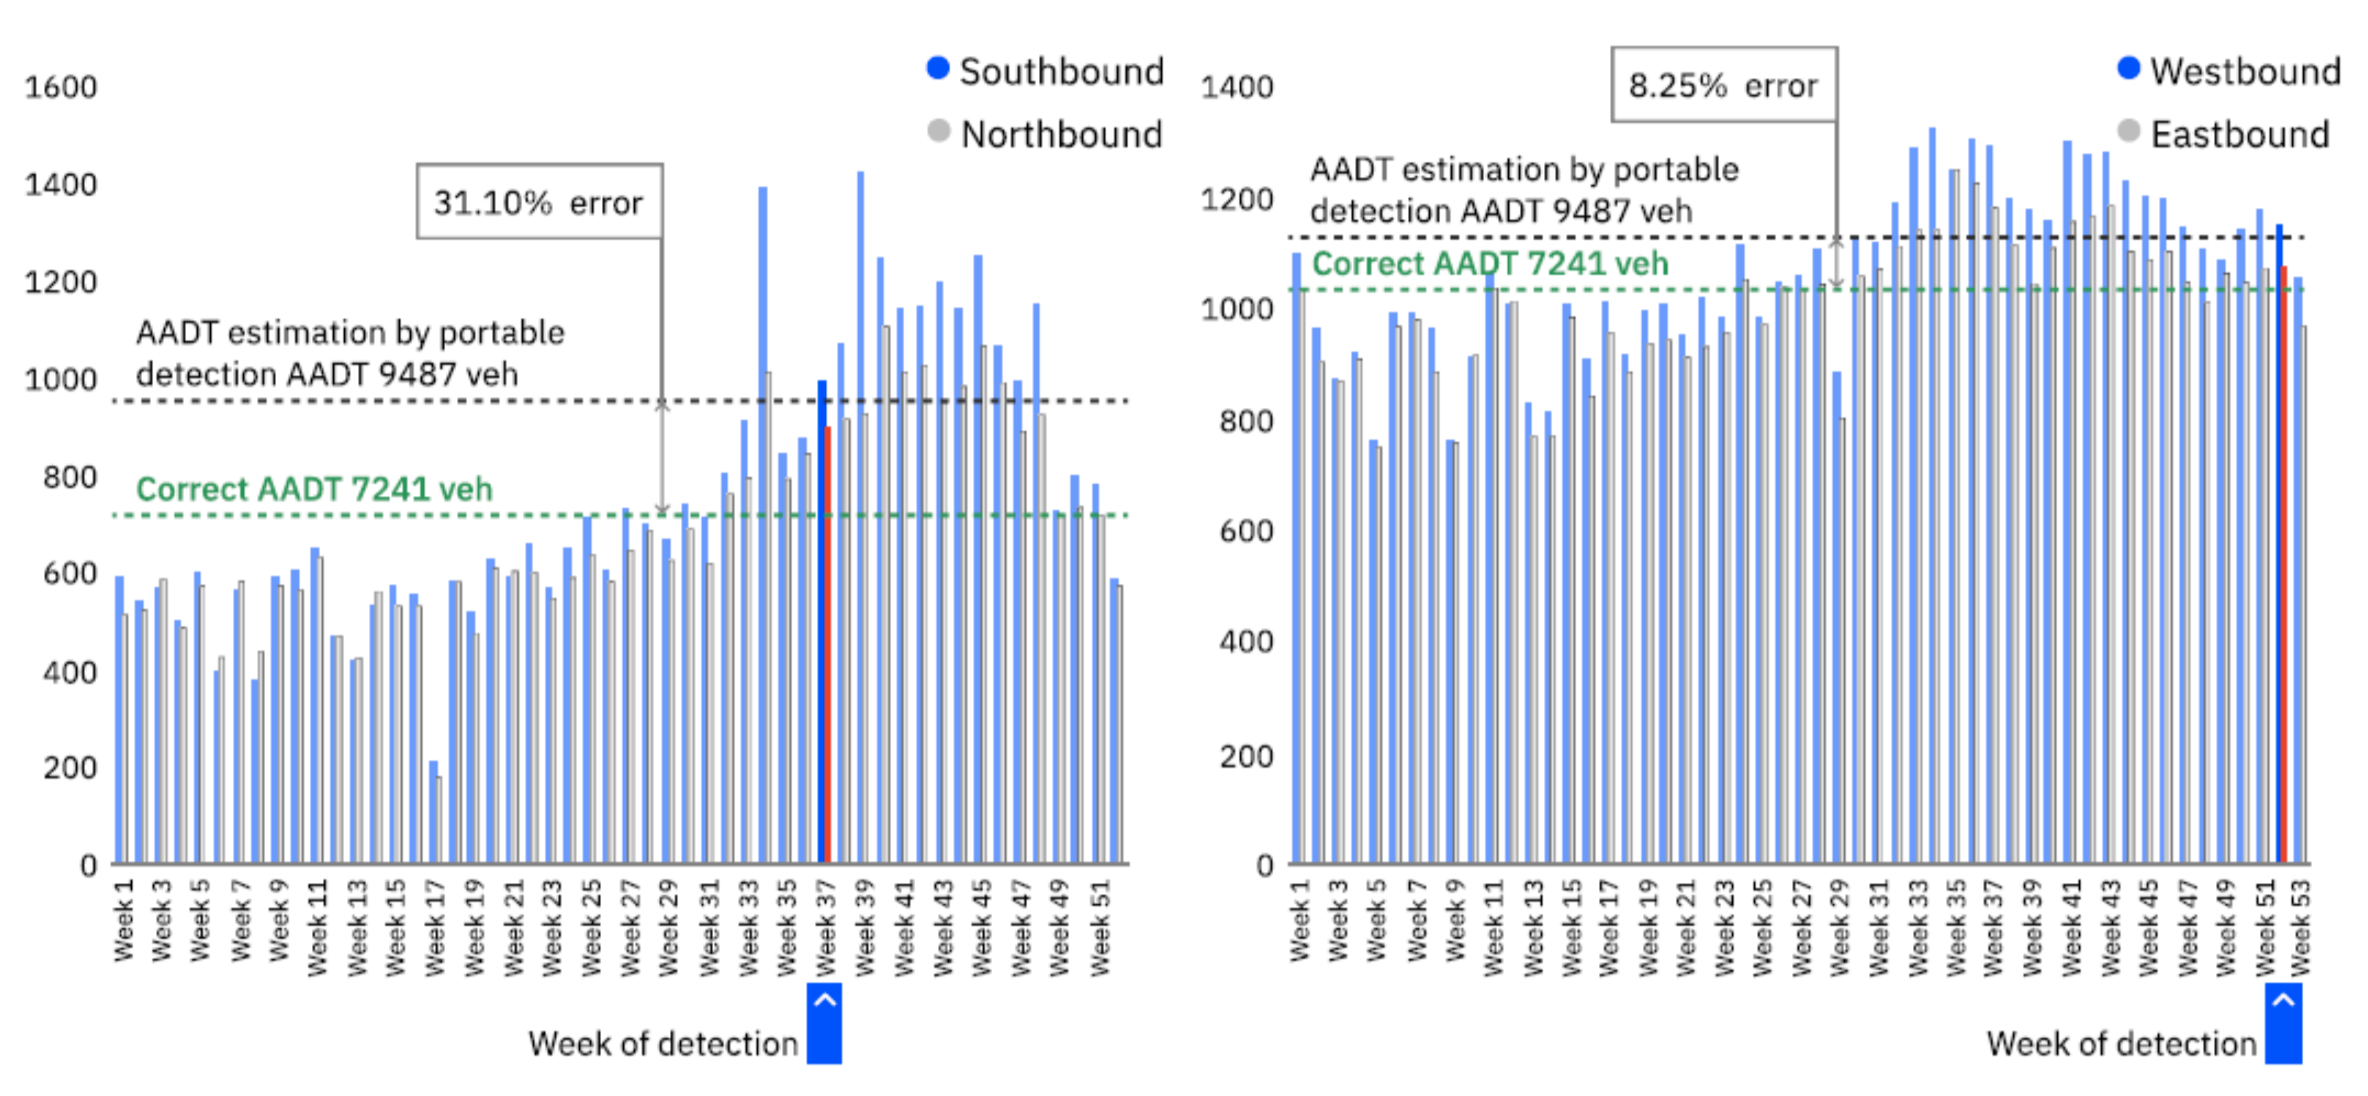
Portable detection data is definitely more accurate since it is based not on several minutes but on a several days observation - usually from two days to a week. But still, it is very far from year-round observation and, therefore, may provide somewhat unreliable results for the locations with pronounced seasonal fluctuations (Figure 5).
In ever-turbulent market conditions, it’s vitally important to seek new ways to win repeat customers, increase sales, and beat the competition. This is why it is beneficial to use modern methods of traffic data analysis to obtain ample and reliable results. Especially since the cost of error in business planning caused by inaccurately understood data 100x times exceeds the cost of proper data and comprehensive analysis.
Proprietary Ticon algorithm based on traffic engineering and multifactor analysis, cross-verifies multiple independent data sources for your company to get real traffic volumes of vehicles passing by any location of interest, providing a full understanding of all year-round fluctuations.
You know best what is the right location for your business. We know best how to find it.
Contact us at info@ticon.co to learn more about data-driven solutions and achieve success in highly competitive markets.