How Traffic Data Explain Customer Behavior


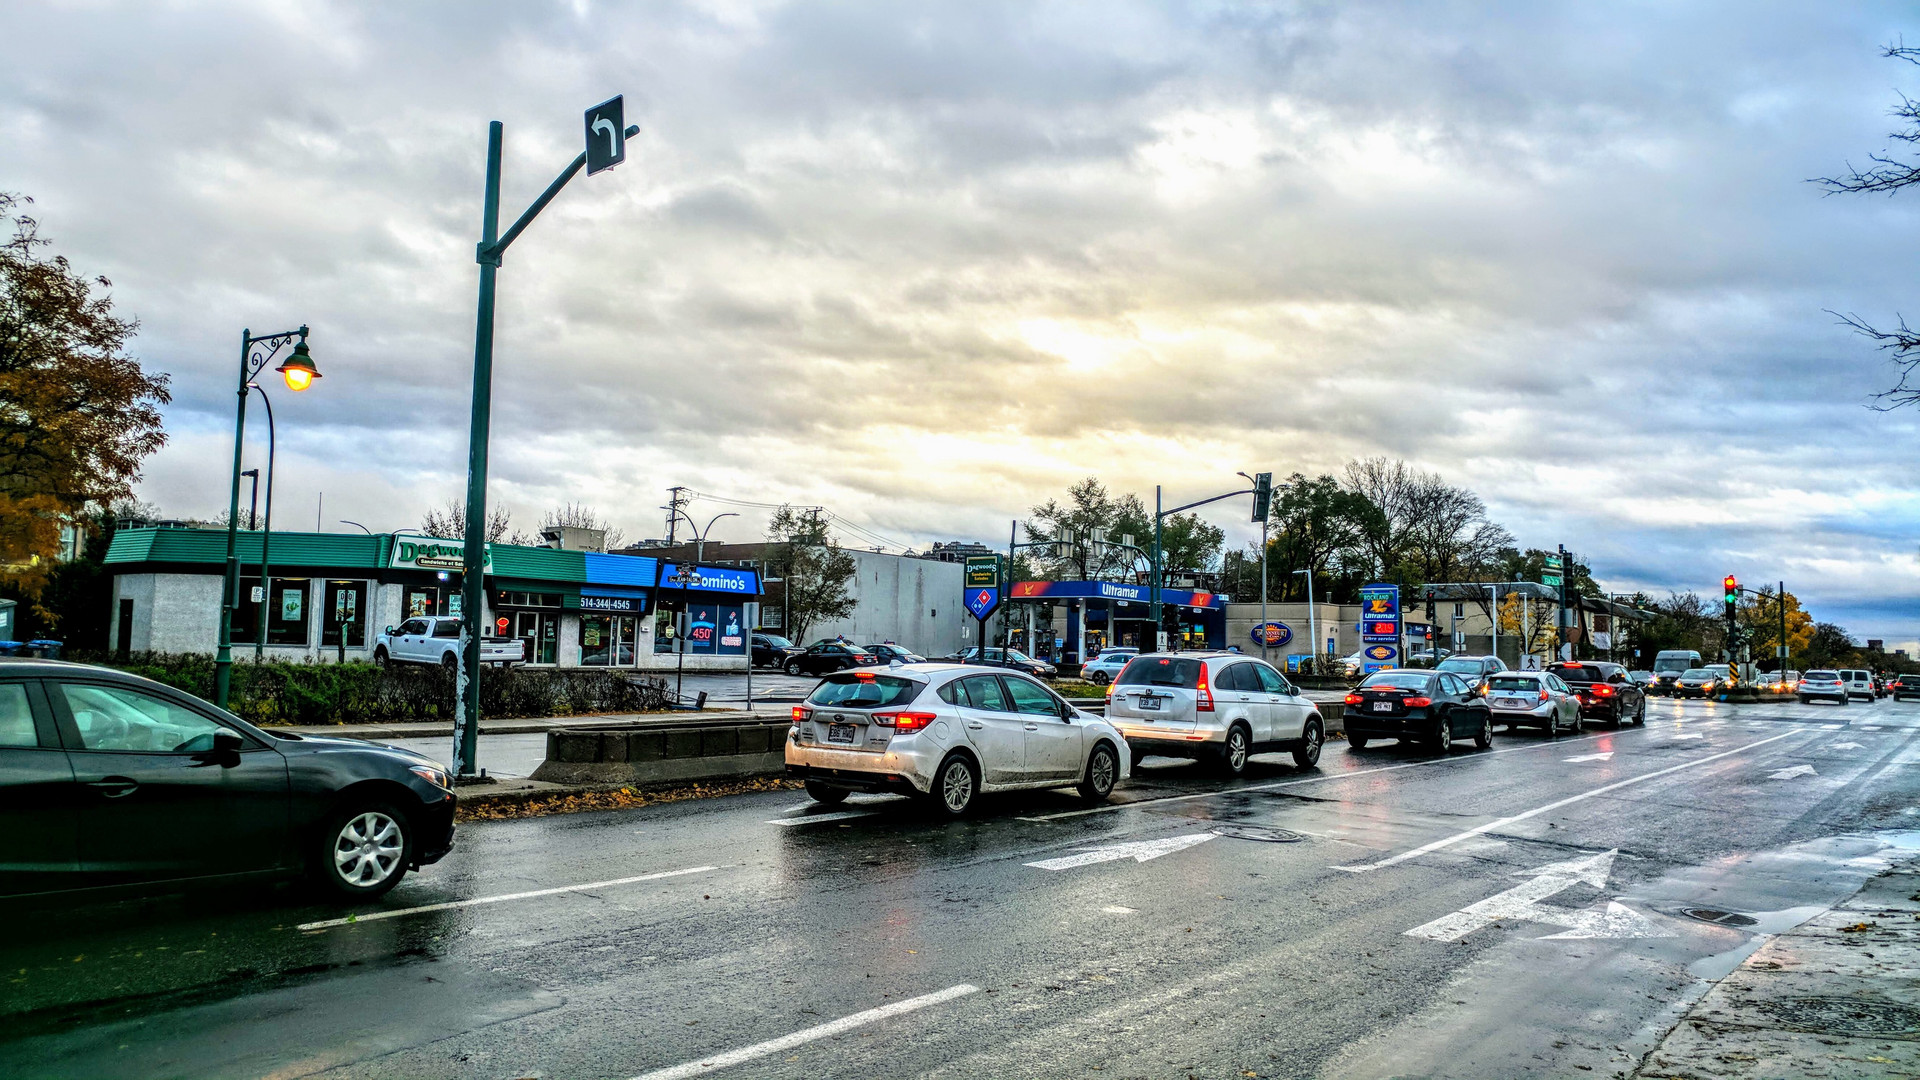
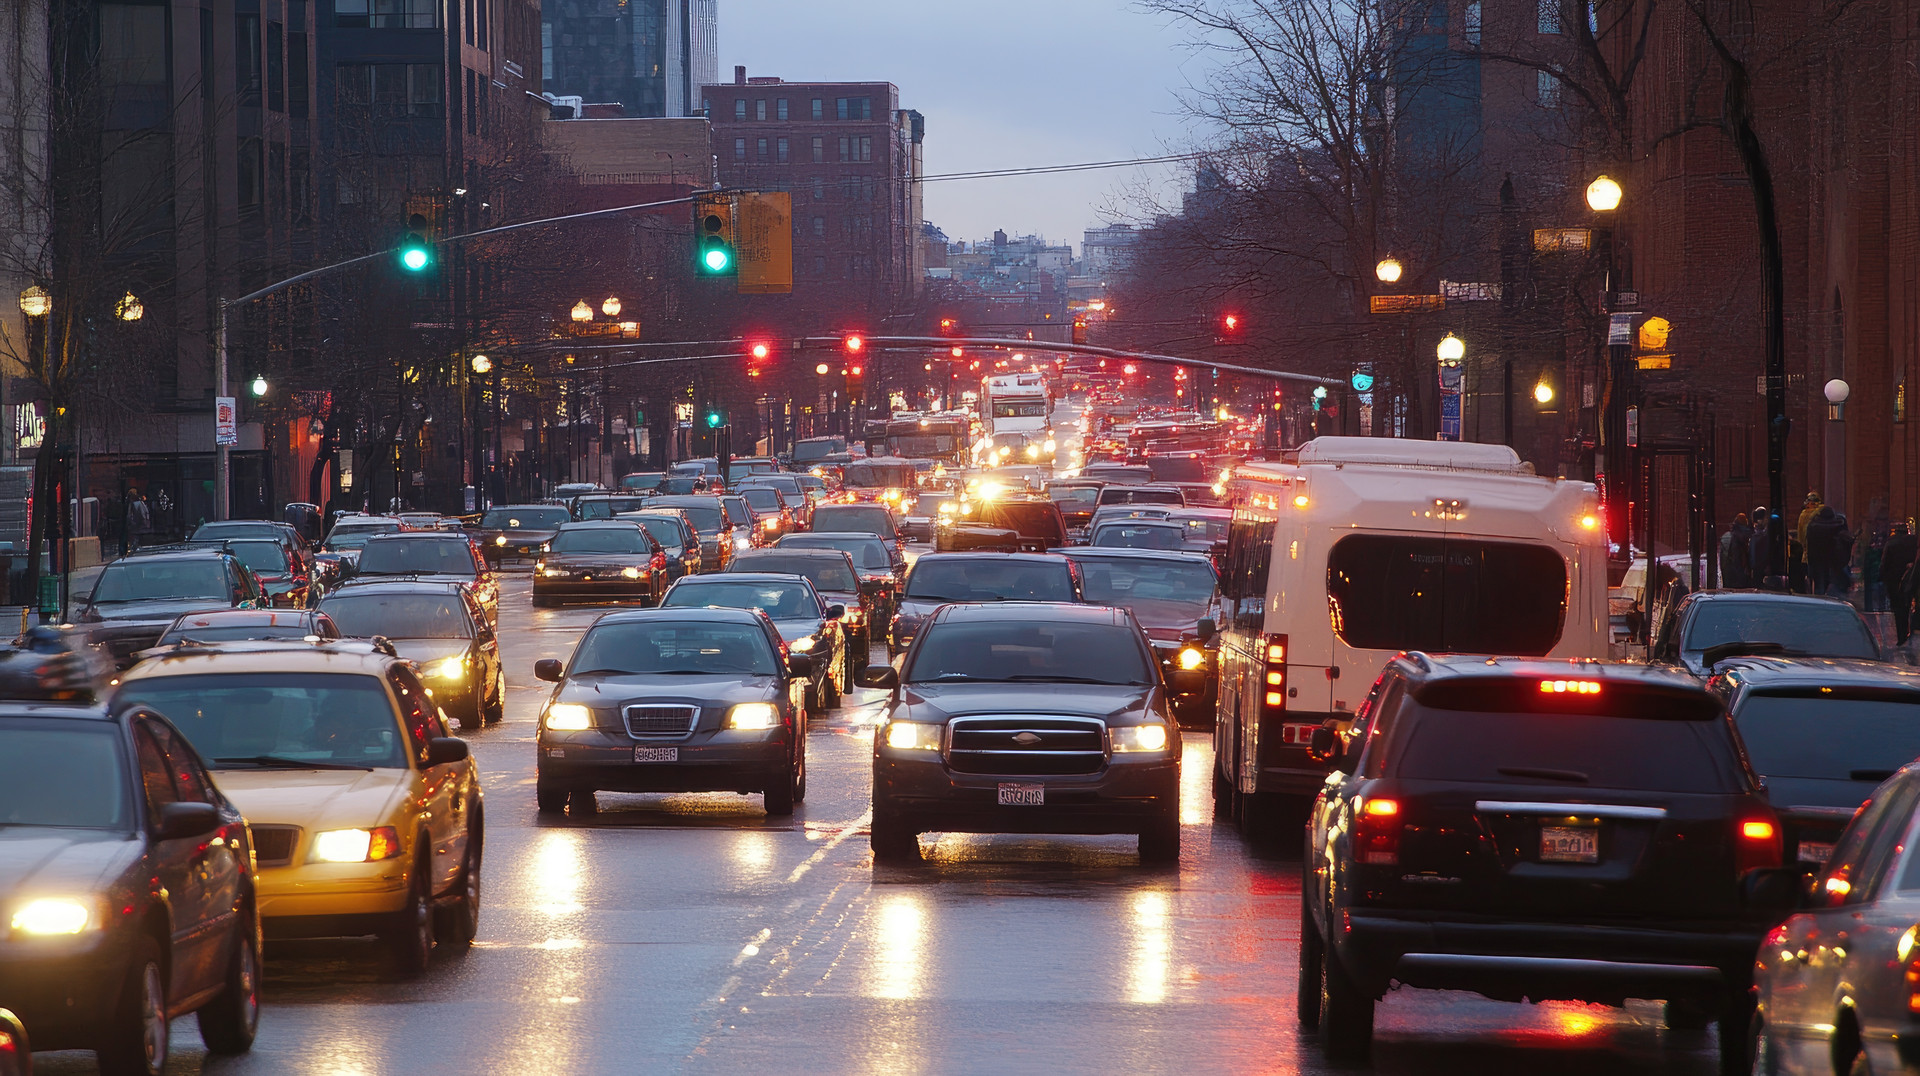
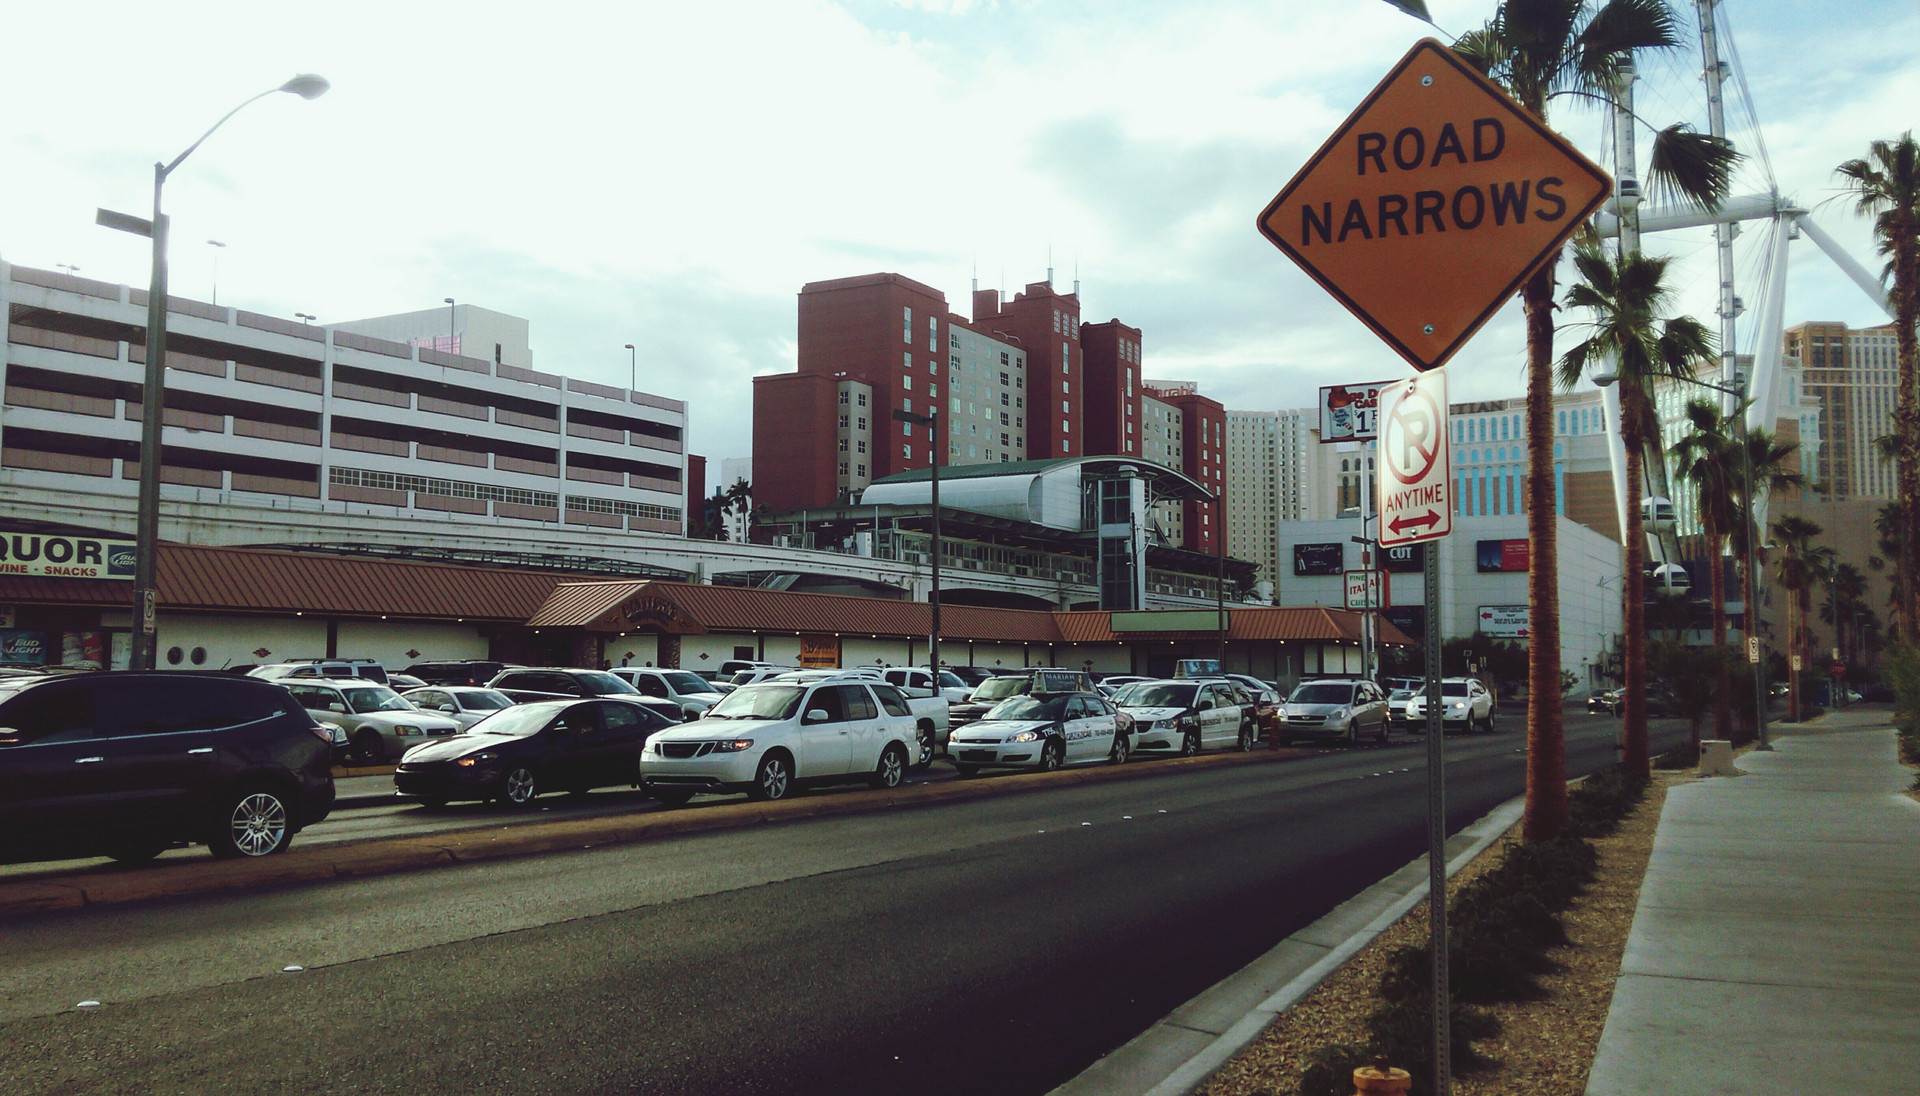
“Mass transit” is what you see through the plate glass window of your store every day: thousands of cars, thousands of people going from point A to point B, and back. This constant movement of vehicles and people generates a considerable amount of data which provides insights into traffic volumes and drivers’ behavior. And what turns drivers into buyers? Their willingness and ability, under certain road conditions, to slow down and park at a shopping facility at a particular segment of the road. This readiness – and ability – depends on the behavior of drivers, which is reflected in the speed and acceleration of their vehicles in traffic. See how the speed distributions differ in the traffic flows: the right graph shows a significant percentage of cars going at a low speed, which makes it much easier to make a maneuver and drive into a parking lot. At the same time, there are a decent number of cars moving at high speed, which indicates the absence of traffic jams at this moment in this particular place. But the analysis of speed distribution by itself is not sufficient to confirm the shopping behavior, because high-speed variance can be influenced by a variety of indirect factors, including traffic lights, road signs, congestion, and more. To avoid these uncertainties, Ticon also considers data on acceleration, lane distribution, terrain and roadway features, weather, and other factors. Ticon multi-factor analytics ensures that the decrease in speeds for a certain percentage of vehicles in the flow is not caused by traffic difficulties but reflects the intentions of drivers to stop shopping in this location. In contrast, on the left graph, most drivers in the traffic flow are moving at the same speed. When we analyze this in combination with the other factors mentioned above, it gives us reasons to characterize the behavior of drivers in this section as "transit", indicating their intention to pass this section of the road without stopping, and without spending their time on shopping. It should be noted that both pictures show traffic flows, characterized by similar average speed and traffic volume values.
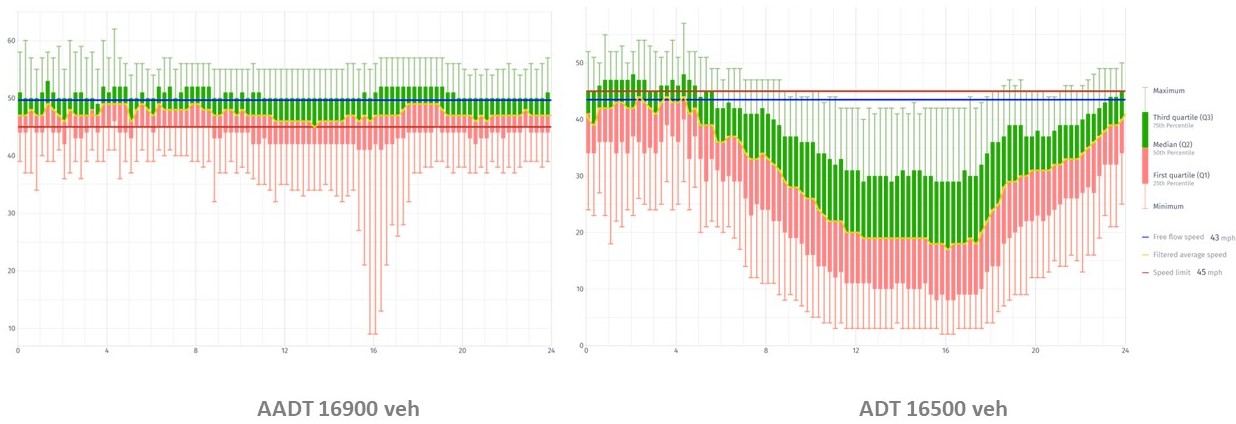
Thus, by applying multi-factor analysis of speed and acceleration distribution patterns, rather than just traffic volume (counts, AADT), and, as a maximum, average traffic flow speed, Ticon provides the best way to choose a new site for your store. Now, when you consider several sites with the same AADT, you can select one site where the driving behavior of potential buyers will be most suitable for the success of your business.