New Metric in C-Site Selection Traffic Analytics


As the sales to convenience retailers ticked up in 2021, with two in three convenience retailers reporting higher in-store sales in 2021 vs. 2020, it is becoming vitally important for the c-store operations professionals to compare the performance of different stores to check how well the store managers utilize their available resources for the growth of sales volume and efficiency under the conditions of changing (growing) consumers demands.
There are multiple factors that can impact the convenience store revenue, and the volume of traffic passing by the store location is one of the most important among them.
At Ticon, we have a tool called C-Site Insight™, that provides precise information on directional vehicular traffic volume exactly at your location of interest.
But let’s dive deeper and see what other factors make two stores achieve different sales KPI when the Average Daily Traffic (ADT) congestion parameter, as well as intraday/weekly/seasonal changes indicators, have similar numbers? The answer is driver behavior.
The indicators of this factor come out of comprehensive AI analysis of vehicle speeds in traffic flow together with maneuverability and other specifics of the location which can be determined by careful consideration of the road network graph.
We include driver behavior indicators in our C-Site Insight report, so our customers can not only see total traffic volume but also judge what percentage of drivers may have an intention to stop for shopping (the graph below shows an example for C-Store location within Pennsylvania, 40310 people in 15-minute accessibility radius).
.png)
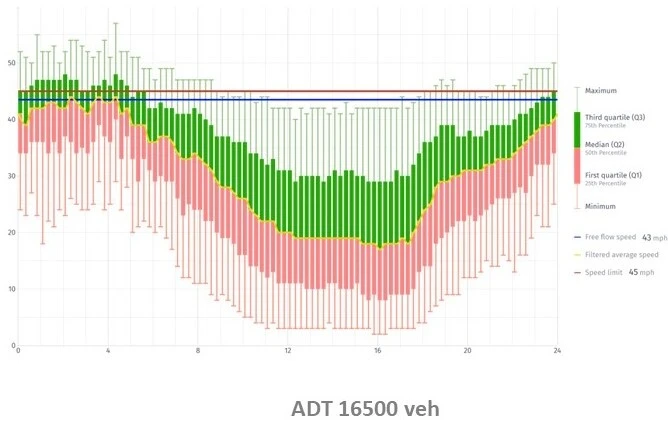
Thus, the C-store regional managers can use this information to justifiably compare the numbers of potential customers at their locations with the sales numbers, and see which stores are doing better sales in similarly accessible locations.
C-Site Insight™ provides a realistic measure of customer base demographics and behavioral patterns, supplying the traffic volumes for vehicles and pedestrians at your site. Armed with reliable facts and verified data, you can make informed operational decisions on staffing change, product allocation, and flexible scheduling, achieving higher customers satisfaction and larger gross profits.
No matter what circumstances challenge your business, now or in the future, you can tackle them better with tools provided by Ticon – including C-Site Insight™.